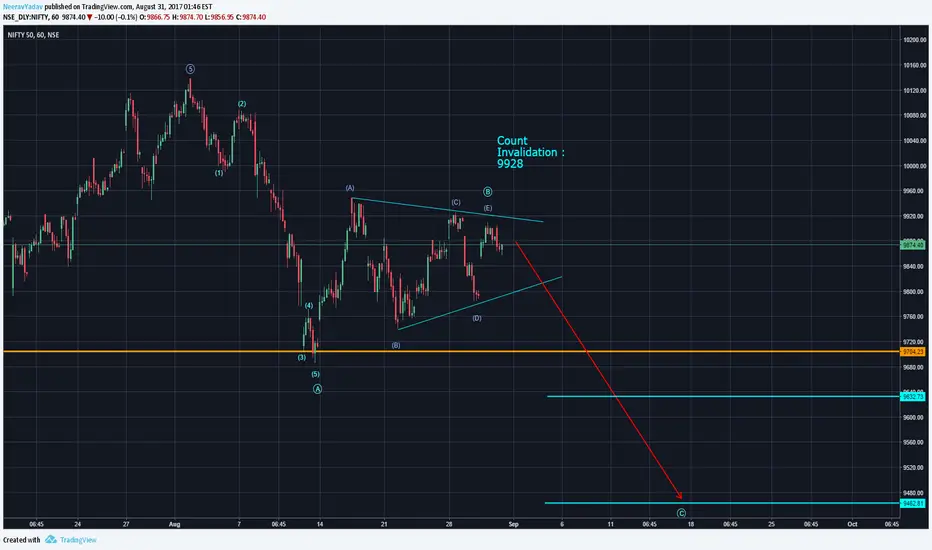
After the decline from 10000 + level it seems that we had a 5 legged down movement which seems to be followed by a Triangle, since triangles can not appear in Wave 2 positions hence the most likely possibility is that Nifty will see another leg down from here on as a Wave C down once the level of 9784 is broken which is also the low of Wave D in the Triangle Wave B (Circled).
If things proceed as expected then we can expect Wave C to reach targets :
T1 : 9632
T2 : 9460
In the upcoming sessions.
I would also like to point out here that triangles can become more complex then expected and hence it might be possible that this structure might still be progressing, hence strict Stop Losses must be used and a less aggressive trading approach would be more suitable in this situation.
I will update further as this market progresses
Note
Low Probability Alternate Bearish Count in Green : Note
*Bullish Count in Green.Note
Updated Count : Looks like a Flat correction may be going on, however if the level of 10090 is taken then the view turns bullish and I will have to take another look. Unmatched 80% plus forecast accuracy for 6 years : 50eyes.com/forecast-accuracy/
Video Course : 50eyes.com/elliott-wave-course
Author : Think with the Markets
Video Course : 50eyes.com/elliott-wave-course
Author : Think with the Markets
Related publications
Disclaimer
The information and publications are not meant to be, and do not constitute, financial, investment, trading, or other types of advice or recommendations supplied or endorsed by TradingView. Read more in the Terms of Use.
Unmatched 80% plus forecast accuracy for 6 years : 50eyes.com/forecast-accuracy/
Video Course : 50eyes.com/elliott-wave-course
Author : Think with the Markets
Video Course : 50eyes.com/elliott-wave-course
Author : Think with the Markets
Related publications
Disclaimer
The information and publications are not meant to be, and do not constitute, financial, investment, trading, or other types of advice or recommendations supplied or endorsed by TradingView. Read more in the Terms of Use.