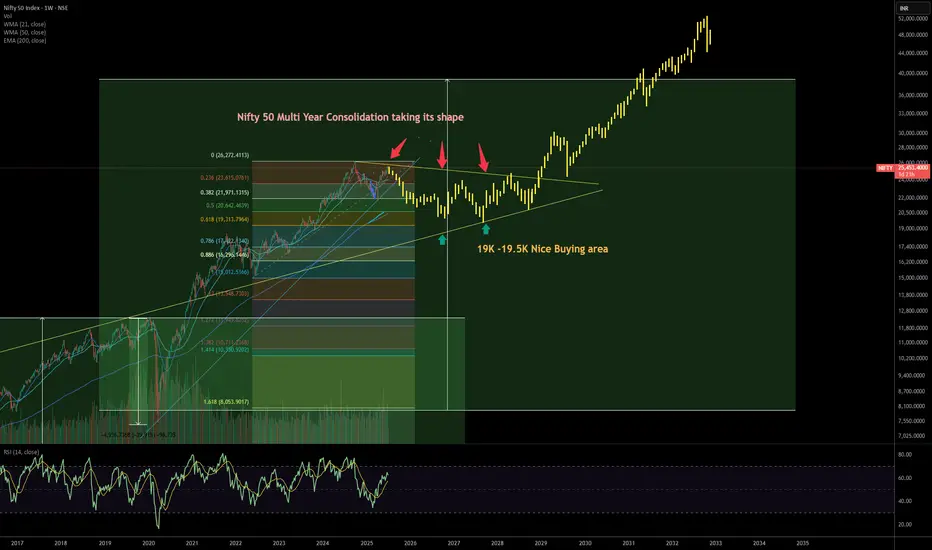
Chart showcases the Nifty 50 Index on a weekly timeframe, highlighted with multi-year consolidation patterns, key Fibonacci retracement levels, and a suggested buy zone—here’s a compelling publishing idea tailored for both traders and long-term investors:
Disclaimer
The information and publications are not meant to be, and do not constitute, financial, investment, trading, or other types of advice or recommendations supplied or endorsed by TradingView. Read more in the Terms of Use.
Disclaimer
The information and publications are not meant to be, and do not constitute, financial, investment, trading, or other types of advice or recommendations supplied or endorsed by TradingView. Read more in the Terms of Use.