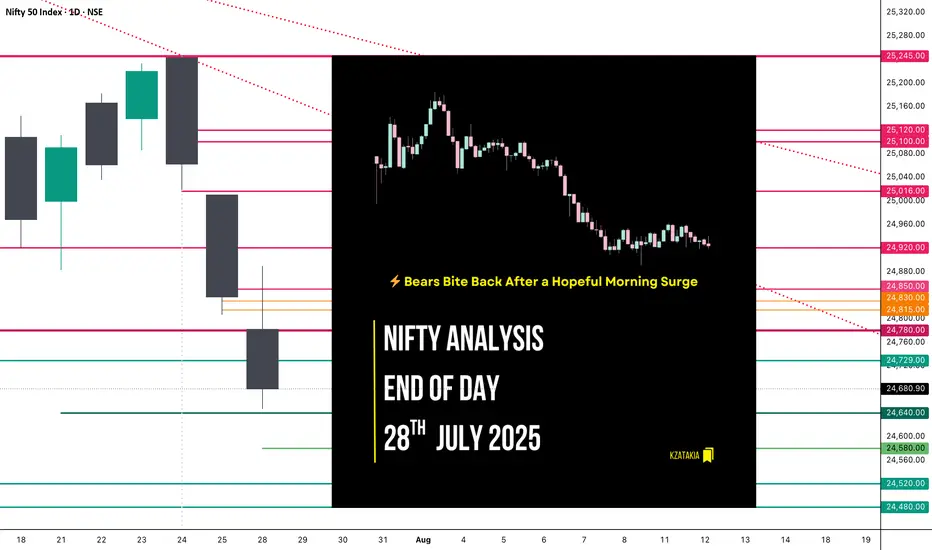
🟢 Nifty Analysis EOD – July 28, 2025 – Monday 🔴
⚡️ Bears Bite Back After a Hopeful Morning Surge
📊 Nifty Summary
Nifty opened with a minor gap-down of 32 points and slipped an additional 67 points in the first 3 minutes, testing the critical support zone of 24,755 ~ 24,729. After marking a day low at 24,732.70, it witnessed a sharp recovery breaching key levels — CDO, Gap, PDC — and touched the CPR BC level. Rejection from there caused a retracement to the mean, followed by another successful attempt breaching CPR BC and IB High. However, it couldn’t sustain above, as profit booking and pressure from a higher time frame bearish trendline dragged the index below the CPR zone and even past the PDL.
Support at 24,780 offered brief relief, but a bearish triangle formed between the HTF trendline and that support and The breakdown at 12:40 led to a clean move, with the pattern target achieved.
🕯 5 Min Time Frame Chart with Intraday Levels

🔁 Trend & Zone Update
📍 Resistance Zone Shifted To: 25,100 ~ 25,120
📍 Support Zone Shifted To: 24,520 ~ 24,480
🧭 What If Plans – 29th July Outlook
🅰️ Plan A (Contra Long Setup)
If market opens inside the previous day range and finds support at 24,700 ~ 24,729,
→ Potential targets: 24,780, 24,815, 24,840
🅱️ Plan B (Trend is Friend – Short Continuation)
If market opens inside range and faces resistance around 24,830 ~ 24,815,
→ Aim for: 24,780, 24,720, 24,640, 24,580
🔄 On-the-Go Plan
If market Gaps Up/Down outside previous day’s range,
→ Wait for IB formation and act based on structure & S/R levels.
🕯 Daily Time Frame Chart with Intraday Levels

🕯 Daily Candle Breakdown
Open: 24,782.45
High: 24,889.20
Low: 24,646.60
Close: 24,680.90
Change: −156.10 (−0.63%)
🕯 Candle Structure Breakdown:
Real Body: 101.55 pts (Red candle, bearish)
Upper Wick: 106.75 pts (Long — rejection from highs)
Lower Wick: 34.30 pts (Defended slightly)
🕯 Interpretation:
Tried to rally above 24,880 but faced aggressive selling. Closed well below open, forming a bearish rejection candle resembling a shooting star. Bears clearly took control after the intraday bounce attempt.
🕯 Key Insight:
Selling pressure visible from 24,880–24,900 zone.
Close below 24,700 keeps bearish tone intact.
Next Support: 24,650–24,620.
Bulls' challenge: Reclaim and close above 24,850.
🛡 5 Min Intraday Chart

⚔️ Gladiator Strategy Update
ATR: 197.91
IB Range: 122 → Medium
Market Structure: Imbalanced
Trades Triggered:
09:27 – Long Entry → 🎯 Target Hit (1:1.5 R:R)
12:40 – Short Entry → 🎯 Target Hit (1:2.5 R:R)
🧱 Support & Resistance Levels
Resistance Zones:
📍 24,729
📍 24,780
📍 24,815 ~ 24,830
📍 24,850
📍 24,920
Support Zones:
📍 24,640
📍 24,580
📍 24,520 ~ 24,480
💭 Final Thoughts
🧠 “Every breakout starts with hesitation — but not every hesitation leads to a breakout.”
Today’s structure showed strong indecision, but sellers used it to dominate.
Monday’s triangle breakdown proved that structure plus patience = power. Keep your bias flexible and trust your levels.
✏️ Disclaimer
This is just my personal viewpoint. Always consult your financial advisor before taking any action.
⚡️ Bears Bite Back After a Hopeful Morning Surge
📊 Nifty Summary
Nifty opened with a minor gap-down of 32 points and slipped an additional 67 points in the first 3 minutes, testing the critical support zone of 24,755 ~ 24,729. After marking a day low at 24,732.70, it witnessed a sharp recovery breaching key levels — CDO, Gap, PDC — and touched the CPR BC level. Rejection from there caused a retracement to the mean, followed by another successful attempt breaching CPR BC and IB High. However, it couldn’t sustain above, as profit booking and pressure from a higher time frame bearish trendline dragged the index below the CPR zone and even past the PDL.
Support at 24,780 offered brief relief, but a bearish triangle formed between the HTF trendline and that support and The breakdown at 12:40 led to a clean move, with the pattern target achieved.
🕯 5 Min Time Frame Chart with Intraday Levels
🔁 Trend & Zone Update
📍 Resistance Zone Shifted To: 25,100 ~ 25,120
📍 Support Zone Shifted To: 24,520 ~ 24,480
🧭 What If Plans – 29th July Outlook
🅰️ Plan A (Contra Long Setup)
If market opens inside the previous day range and finds support at 24,700 ~ 24,729,
→ Potential targets: 24,780, 24,815, 24,840
🅱️ Plan B (Trend is Friend – Short Continuation)
If market opens inside range and faces resistance around 24,830 ~ 24,815,
→ Aim for: 24,780, 24,720, 24,640, 24,580
🔄 On-the-Go Plan
If market Gaps Up/Down outside previous day’s range,
→ Wait for IB formation and act based on structure & S/R levels.
🕯 Daily Time Frame Chart with Intraday Levels
🕯 Daily Candle Breakdown
Open: 24,782.45
High: 24,889.20
Low: 24,646.60
Close: 24,680.90
Change: −156.10 (−0.63%)
🕯 Candle Structure Breakdown:
Real Body: 101.55 pts (Red candle, bearish)
Upper Wick: 106.75 pts (Long — rejection from highs)
Lower Wick: 34.30 pts (Defended slightly)
🕯 Interpretation:
Tried to rally above 24,880 but faced aggressive selling. Closed well below open, forming a bearish rejection candle resembling a shooting star. Bears clearly took control after the intraday bounce attempt.
🕯 Key Insight:
Selling pressure visible from 24,880–24,900 zone.
Close below 24,700 keeps bearish tone intact.
Next Support: 24,650–24,620.
Bulls' challenge: Reclaim and close above 24,850.
🛡 5 Min Intraday Chart
⚔️ Gladiator Strategy Update
ATR: 197.91
IB Range: 122 → Medium
Market Structure: Imbalanced
Trades Triggered:
09:27 – Long Entry → 🎯 Target Hit (1:1.5 R:R)
12:40 – Short Entry → 🎯 Target Hit (1:2.5 R:R)
🧱 Support & Resistance Levels
Resistance Zones:
📍 24,729
📍 24,780
📍 24,815 ~ 24,830
📍 24,850
📍 24,920
Support Zones:
📍 24,640
📍 24,580
📍 24,520 ~ 24,480
💭 Final Thoughts
🧠 “Every breakout starts with hesitation — but not every hesitation leads to a breakout.”
Today’s structure showed strong indecision, but sellers used it to dominate.
Monday’s triangle breakdown proved that structure plus patience = power. Keep your bias flexible and trust your levels.
✏️ Disclaimer
This is just my personal viewpoint. Always consult your financial advisor before taking any action.
Read my blogs here:
substack.com/@kzatakia
Follow me on Telegram:
t.me/swingtraderhub
Follow me on X:
x.com/kzatakia
substack.com/@kzatakia
Follow me on Telegram:
t.me/swingtraderhub
Follow me on X:
x.com/kzatakia
Related publications
Disclaimer
The information and publications are not meant to be, and do not constitute, financial, investment, trading, or other types of advice or recommendations supplied or endorsed by TradingView. Read more in the Terms of Use.