Bollinger band in a beautiful tool of Technical analysis. There are three lines in it. The upper bandwidth line, the middle line and the lower band width line.
As you can see in the chart. Whenever the stock or an index price touches or crosses the upper line the indication it gives is that the market is overbought and there is an imminent selling pressure.
Middle line indicates either resistance or support depending on the position of the candle within the band. It further indicates that Middle line will be support when the price is above it. It also indicates that middle Bollinger band will be a resistnace when the candles are below it.
Lower bandwidth line indicates a support zone. When the candles touch or cross it the indication it gives is that the market is oversold and there can be an imminent up move once this phenomenon happens.
Bollinger band in like a channel or a parallel chanel but a more accurate one and a more asymmetric one.
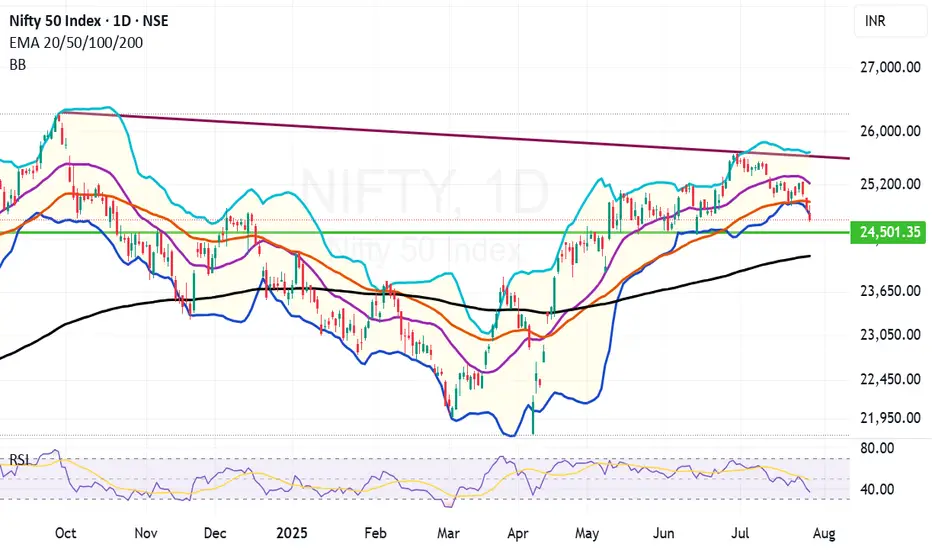
Currently you can see in the chart that Bollinger band has not only touched but also crossed the bottom bandwidth. This is an indication of an over sold market. Thus the indications we get from this tool are that there are very high chances for a short covering recovery or relief rally.
The indication is in sync with Tariff deadline which is tomorrow. Thus any positive announcement on that front can also initiate a strong or mild recovery rally. Thus we might see a bottom formation and recovery rather sooner than later.
Current Nifty closing is at:24680.
Upper band width is at: 25683 (This zone will work as strong resistance zone).
Mid Bandwidth is at: 25217 (This zone will be a Strong resistance).
Mother Line: 24942 (Strong Resistance).
Lower band width is at: 24750 (Weak Resistance).
Nearby support: 24501 (Support).
Father Line: 24157 (Strong Support).
It is a good time to reshuffle your Portfolios and initiate fresh buying in the blue-chip stocks which might be available at a good valuation.
Disclaimer: The above information is provided for educational purpose, analysis and paper trading only. Please don't treat this as a buy or sell recommendation for the stock or index. The Techno-Funda analysis is based on data that is more than 3 months old. Supports and Resistances are determined by historic past peaks and Valley in the chart. Many other indicators and patterns like EMA, RSI, MACD, Volumes, Fibonacci, parallel channel etc. use historic data which is 3 months or older cyclical points. There is no guarantee they will work in future as markets are highly volatile and swings in prices are also due to macro and micro factors based on actions taken by the company as well as region and global events. Equity investment is subject to risks. I or my clients or family members might have positions in the stocks that we mention in our educational posts. We will not be responsible for any Profit or loss that may occur due to any financial decision taken based on any data provided in this message. Do consult your investment advisor before taking any financial decisions. Stop losses should be an important part of any investment in equity.
As you can see in the chart. Whenever the stock or an index price touches or crosses the upper line the indication it gives is that the market is overbought and there is an imminent selling pressure.
Middle line indicates either resistance or support depending on the position of the candle within the band. It further indicates that Middle line will be support when the price is above it. It also indicates that middle Bollinger band will be a resistnace when the candles are below it.
Lower bandwidth line indicates a support zone. When the candles touch or cross it the indication it gives is that the market is oversold and there can be an imminent up move once this phenomenon happens.
Bollinger band in like a channel or a parallel chanel but a more accurate one and a more asymmetric one.
Currently you can see in the chart that Bollinger band has not only touched but also crossed the bottom bandwidth. This is an indication of an over sold market. Thus the indications we get from this tool are that there are very high chances for a short covering recovery or relief rally.
The indication is in sync with Tariff deadline which is tomorrow. Thus any positive announcement on that front can also initiate a strong or mild recovery rally. Thus we might see a bottom formation and recovery rather sooner than later.
Current Nifty closing is at:24680.
Upper band width is at: 25683 (This zone will work as strong resistance zone).
Mid Bandwidth is at: 25217 (This zone will be a Strong resistance).
Mother Line: 24942 (Strong Resistance).
Lower band width is at: 24750 (Weak Resistance).
Nearby support: 24501 (Support).
Father Line: 24157 (Strong Support).
It is a good time to reshuffle your Portfolios and initiate fresh buying in the blue-chip stocks which might be available at a good valuation.
Disclaimer: The above information is provided for educational purpose, analysis and paper trading only. Please don't treat this as a buy or sell recommendation for the stock or index. The Techno-Funda analysis is based on data that is more than 3 months old. Supports and Resistances are determined by historic past peaks and Valley in the chart. Many other indicators and patterns like EMA, RSI, MACD, Volumes, Fibonacci, parallel channel etc. use historic data which is 3 months or older cyclical points. There is no guarantee they will work in future as markets are highly volatile and swings in prices are also due to macro and micro factors based on actions taken by the company as well as region and global events. Equity investment is subject to risks. I or my clients or family members might have positions in the stocks that we mention in our educational posts. We will not be responsible for any Profit or loss that may occur due to any financial decision taken based on any data provided in this message. Do consult your investment advisor before taking any financial decisions. Stop losses should be an important part of any investment in equity.
Disclaimer
The information and publications are not meant to be, and do not constitute, financial, investment, trading, or other types of advice or recommendations supplied or endorsed by TradingView. Read more in the Terms of Use.
Disclaimer
The information and publications are not meant to be, and do not constitute, financial, investment, trading, or other types of advice or recommendations supplied or endorsed by TradingView. Read more in the Terms of Use.