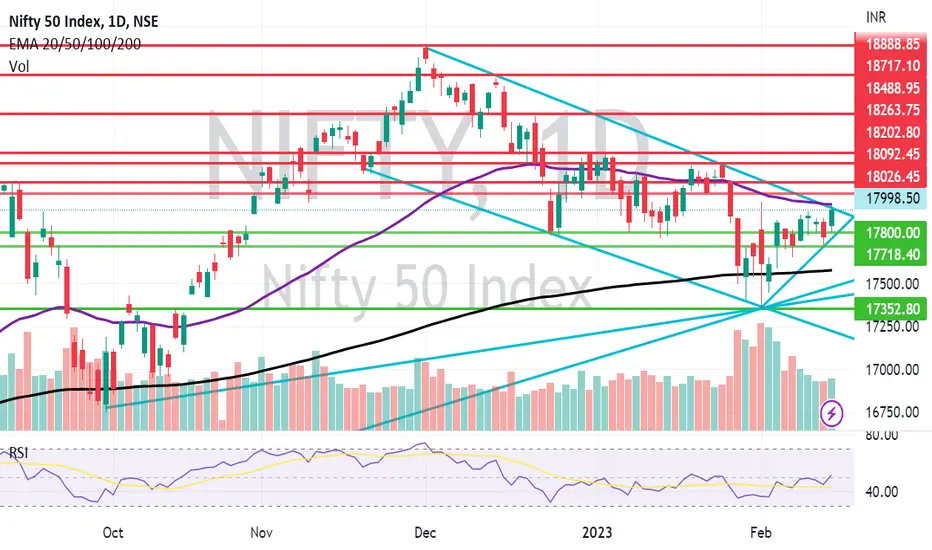
As you can see in the chart. It was a perfect candle taking a perfect support near 17795 zone (Today's low 17800). From where it kept on going North until it was stopped by a perfect resistance of 50 days EMA which was at 17960 (High of the day was 17954.55). Those who doubt Technical analysis and say that these are just post mortem lines without any meaning should have a look at the chart and see the importance of Technical analysis.
Also look at the trend line or Asymmetrical line resistance generating from recent high of Nifty at 18887.6 which stopped Nifty twice before once near 18703 on 14th December and once 18201 on 24th January. That line acted as a resistance today again and As Nifty was surging ahead and went upto 17954.55 brought it back to 17929.
Also you can see the 50 days resistance at 17960 which pushed the Nifty down before it could can touch it as the Nifty ended the day near 17929.
How to overcome these two important resistance?
Ans: They can be overcome by a gap up opening.
How can we get a gap up opening?
There is US Inflation Data tonight . If the data is good we might get a gap up opening tomorrow and once Nifty sustains above 50 EMA and trend line resistance...We can see it go further and far....
Critical day tomorrow.
Disclaimer
The information and publications are not meant to be, and do not constitute, financial, investment, trading, or other types of advice or recommendations supplied or endorsed by TradingView. Read more in the Terms of Use.
Disclaimer
The information and publications are not meant to be, and do not constitute, financial, investment, trading, or other types of advice or recommendations supplied or endorsed by TradingView. Read more in the Terms of Use.