🟢 Nifty Analysis EOD – August 2, 2025 – Friday 🔴
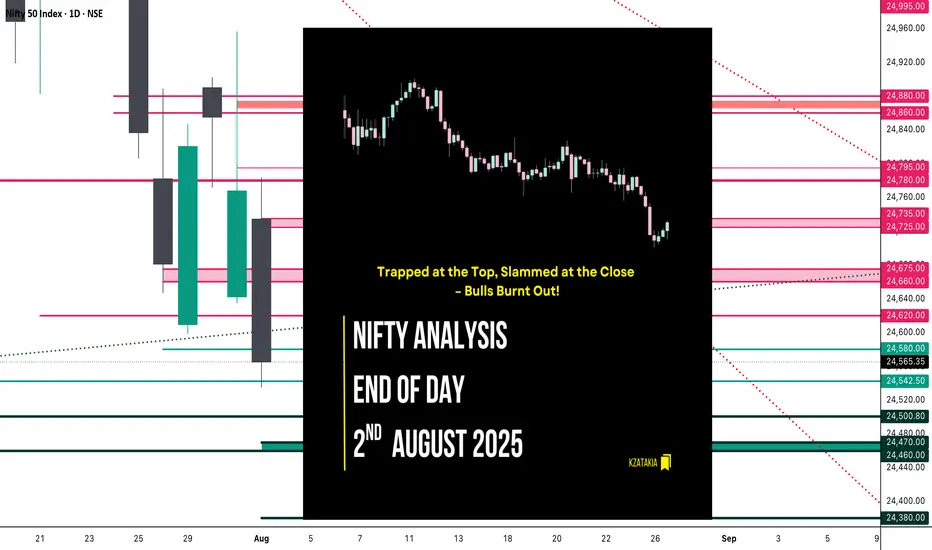
Trapped at the Top, Slammed at the Close – Bulls Burnt Out!
🗓️ Nifty Summary
With the continuation of yesterday's hidden weakness, today's session gave early hope but ended with a bearish surprise. Nifty opened near the key support zone of 24,735 ~ 24,725, hovered indecisively, then suddenly rallied to 24,780, trapping bulls just under resistance.
But the trap was set.
A sharp reversal followed as Nifty broke not just the day’s low, but also the previous day’s support zone of 24,660 ~ 24,675, pulling the index lower into the 24,565.35 close — the second lowest close since May 12.
A fierce 2–3 hour tug-of-war between bulls and bears took place in a tight 40–50 point range until 2:50 PM, when bulls gave up—leading to a 100+ point fall in the last half-hour. shocked many traders, especially those fatigued from the earlier choppy action.
Much like yesterday, both sides of the trade were available today.
Did you catch them?
Zoom Out View :
Today’s close is just 23 points above the June 3 close, wiping out nearly 59 sessions (81 days) of gain.
Will the zone of 24460 ~ 24542 provide support again, or are we headed for a retest of the 24000 ~ 23800 and 23200 ~ 22800 (Pattern Target and Virgin) range?
Yes, you read correctly 23200 ~ 22800…!
Not so soon…but eventually…!
wish you tell me crazy and hope I am wrong…!
📈 5 Min Time Frame Chart with Intraday Levels

📉 Daily Time Frame Chart with Intraday Levels

🕯️ Daily Candle Breakdown
Open: 24,734.90
High: 24,784.15
Low: 24,535.05
Close: 24,565.35
Change: −203.00 (−0.82%)
Candle Structure
🔴 Large bearish body (169.55 pts)
☁️ Moderate upper wick (49.25 pts)
⬇️ Short lower wick (30.30 pts)
Interpretation
Opened lower, climbed early but failed at 24,780+.
Selling dominated the rest of the session, closing near lows.
Moderate upper wick shows early bullish attempt was rejected.
Candle Type
Bearish Marubozu-like – clear seller dominance.
Key Insight
🛡 5 Min Intraday Chart

⚔️ Gladiator Strategy Update
ATR: 212.37
IB Range: 87.55 → Medium
Market Structure: Balanced
Trades Triggered
🕙 10:05 AM – Long Entry → 🎯 Target Hit (R:R – 1:1)
🕚 11:09 AM – Short Entry → 🎯 Target Hit (R:R – 1:2)
🔍 Trade Summary
Both sides were offered—clean hit on long and solid breakdown on short. A Gladiator’s delight.
📊 Support & Resistance Levels
🔼 Resistance Zones
🔽 Support Zones
💬 Final Thoughts
"Traps are laid where confidence is highest. Stay alert, stay flexible."
A textbook day where patience paid off — those who didn’t force trades were rewarded with clean moves in both directions.
✏️ Disclaimer
This is just my personal viewpoint. Always consult your financial advisor before taking any action.
Trapped at the Top, Slammed at the Close – Bulls Burnt Out!
🗓️ Nifty Summary
With the continuation of yesterday's hidden weakness, today's session gave early hope but ended with a bearish surprise. Nifty opened near the key support zone of 24,735 ~ 24,725, hovered indecisively, then suddenly rallied to 24,780, trapping bulls just under resistance.
But the trap was set.
A sharp reversal followed as Nifty broke not just the day’s low, but also the previous day’s support zone of 24,660 ~ 24,675, pulling the index lower into the 24,565.35 close — the second lowest close since May 12.
A fierce 2–3 hour tug-of-war between bulls and bears took place in a tight 40–50 point range until 2:50 PM, when bulls gave up—leading to a 100+ point fall in the last half-hour. shocked many traders, especially those fatigued from the earlier choppy action.
Much like yesterday, both sides of the trade were available today.
Did you catch them?
Zoom Out View :
Today’s close is just 23 points above the June 3 close, wiping out nearly 59 sessions (81 days) of gain.
Will the zone of 24460 ~ 24542 provide support again, or are we headed for a retest of the 24000 ~ 23800 and 23200 ~ 22800 (Pattern Target and Virgin) range?
Yes, you read correctly 23200 ~ 22800…!
Not so soon…but eventually…!
wish you tell me crazy and hope I am wrong…!
📈 5 Min Time Frame Chart with Intraday Levels
📉 Daily Time Frame Chart with Intraday Levels
🕯️ Daily Candle Breakdown
Open: 24,734.90
High: 24,784.15
Low: 24,535.05
Close: 24,565.35
Change: −203.00 (−0.82%)
Candle Structure
🔴 Large bearish body (169.55 pts)
☁️ Moderate upper wick (49.25 pts)
⬇️ Short lower wick (30.30 pts)
Interpretation
Opened lower, climbed early but failed at 24,780+.
Selling dominated the rest of the session, closing near lows.
Moderate upper wick shows early bullish attempt was rejected.
Candle Type
Bearish Marubozu-like – clear seller dominance.
Key Insight
- Sellers defended 24,780–24,800 zone.
- Closing near 24,560 keeps the short-term bias bearish.
- Next support: 24,500, 24,470 ~ 24460
- ⚠️ Bulls must reclaim 24,735+ on closing basis to neutralize sentiment.
🛡 5 Min Intraday Chart
⚔️ Gladiator Strategy Update
ATR: 212.37
IB Range: 87.55 → Medium
Market Structure: Balanced
Trades Triggered
🕙 10:05 AM – Long Entry → 🎯 Target Hit (R:R – 1:1)
🕚 11:09 AM – Short Entry → 🎯 Target Hit (R:R – 1:2)
🔍 Trade Summary
Both sides were offered—clean hit on long and solid breakdown on short. A Gladiator’s delight.
📊 Support & Resistance Levels
🔼 Resistance Zones
- 24620
- 24660 ~ 24675
- 24725 ~ 24735
- 24780 ~ 24795
- 24860 ~ 24880
🔽 Support Zones
- 24,542 ~ 24,535
- 24,500
- 24,470 ~ 24,460
- 24,380
💬 Final Thoughts
"Traps are laid where confidence is highest. Stay alert, stay flexible."
A textbook day where patience paid off — those who didn’t force trades were rewarded with clean moves in both directions.
✏️ Disclaimer
This is just my personal viewpoint. Always consult your financial advisor before taking any action.
Read my blogs here:
substack.com/@kzatakia
Follow me on Telegram:
t.me/swingtraderhub
Follow me on X:
x.com/kzatakia
substack.com/@kzatakia
Follow me on Telegram:
t.me/swingtraderhub
Follow me on X:
x.com/kzatakia
Related publications
Disclaimer
The information and publications are not meant to be, and do not constitute, financial, investment, trading, or other types of advice or recommendations supplied or endorsed by TradingView. Read more in the Terms of Use.