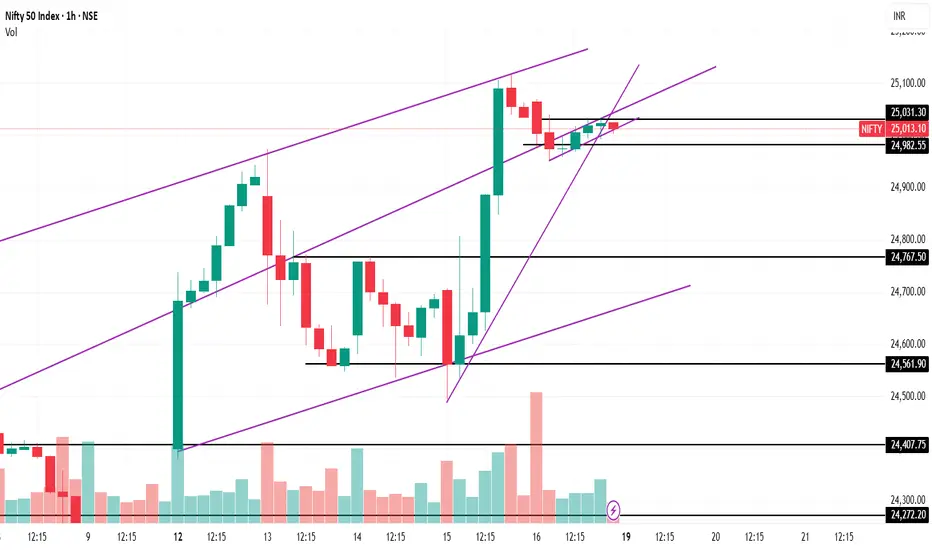
1. Trend Channel: The index is moving within a well-defined **upward sloping channel**, marked by two parallel purple trendlines.
* Price is currently hovering near the **upper boundary** of the broader ascending channel — a potential area for either breakout or rejection.
2. Short-Term Rising Wedge: A narrow rising wedge is visible (formed with tighter converging trendlines in the last few candles).
* Rising wedges are generally considered bearish reversal patterns, especially near resistance zones, suggesting potential for a pullback.
3. Resistance Levels: 25,031.30 : Immediate resistance (recent high & wedge upper boundary). A breakout above this could lead to a strong bullish continuation.
Upper channel trendline: Around 25,050–25,100 zone — further confluence resistance.
4. Support Levels: 24,982.55 Near-term support (bottom of the wedge structure). A breakdown below this level confirms wedge breakdown.
24,767.50 : Strong horizontal support from prior consolidation zone.
24,561.90, 24,407.75, and 24,272.20 : Sequential key support levels for downside targets if a breakdown accelerates.
**Volume Analysis:**
1. Volume Spike seen during the recent bullish candles, indicating strong buying interest. However, during the formation of the wedge, volume has declined, signaling weakening momentum— a typical precursor to a breakout or breakdown.
Possible Scenarios:
Bullish Scenario:
Break above 25,031.30 with volume could initiate a **fresh leg of uptrend**, possibly targeting the upper end of the channel (\~25,100+).
Bearish Scenario:
Breakdown below 24,982.55 from the wedge pattern could trigger a **short-term correction**, with immediate targets at 24,767.50 and 24,561.90.
The bearish divergence between price action and declining volume further supports this view.
Related publications
Disclaimer
The information and publications are not meant to be, and do not constitute, financial, investment, trading, or other types of advice or recommendations supplied or endorsed by TradingView. Read more in the Terms of Use.
Related publications
Disclaimer
The information and publications are not meant to be, and do not constitute, financial, investment, trading, or other types of advice or recommendations supplied or endorsed by TradingView. Read more in the Terms of Use.