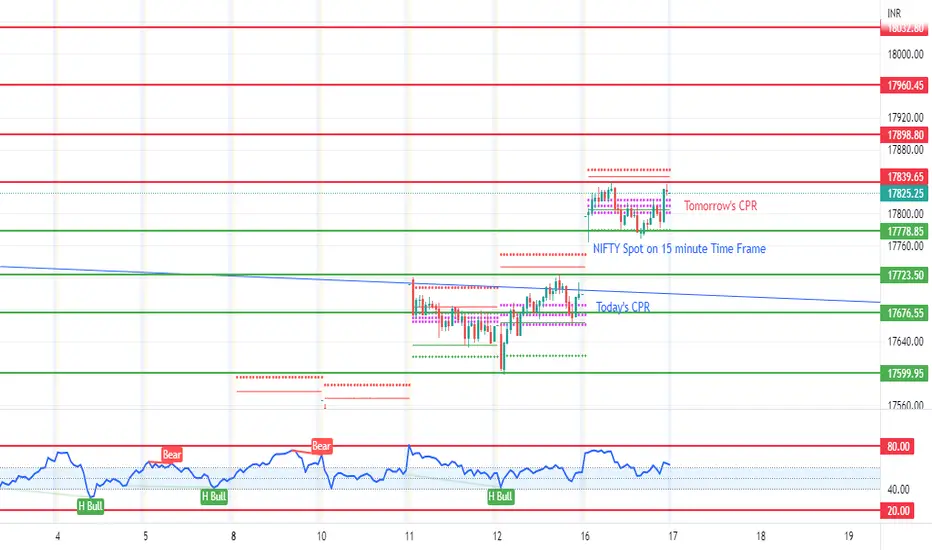
Important Point-Nifty broke its channel which was followed since last one year, and on daily time frame RSI is over 80 (83), with a gap between last two candles. So, we may expect Nifty to come down, to fill up the gap and RSI to settle down before continuing its up move.
But if we see in smaller time frame today Nifty initially tried to do some pullback but in later half again continued the up move forming a higher low.
Again importantly, 17800 level is still having highest OI in CE side and followed by 18000. So, there may be a possibility of Nifty halting at this level again tomorrow, and probably expiry within the range between 17700 which is having highest OI in PE side and 18000.
For tomorrow, we will consider the zone between 17839 and 17778 as no trade zone, especially for option buyers, in fact above 17839 also we may avoid option buying as above this level too, price movement (upside) may be slow, which will lead to decay. So above 17839, we will sell put options, if tomorrow Nifty opens in no trade zone and then crosses this level. 17898, 17960 and 18032 will be the resistance levels.
Similarly, if it crosses 17778, then we may go for a bearish trade, with either PE buying or CE selling, but will have to be carful with the support levels at 17723 and 17676 and diagonal trend line marked with colour blue. Again, important point is today’s CPR, which is a virgin one, and the gap between last two candles, which will act as a strong support, with OI at 17700.
And if it opens near this support level, will go for bullish trade, with very minimum stop loss, and similarly for huge gap up opening near resistance levels, if situation permits may go for short.
Below are the important levels for tomorrow
Daily Central Pivot Range from 17817 to 17801
Weekly Central Pivot Range from 17646 to 17542
Monthly Central Pivot Range from 16886 to 16341
*All support and resistance plotted are based on PDH/PDL. For any reversal after breaking PDH/PDL, support and resistance levels will be different*
**Time of plotting the levels and planning 16th August, 9:15 PM**
***Personal opinion, not a trading advice***
#NIFTY50
Disclaimer
The information and publications are not meant to be, and do not constitute, financial, investment, trading, or other types of advice or recommendations supplied or endorsed by TradingView. Read more in the Terms of Use.
Disclaimer
The information and publications are not meant to be, and do not constitute, financial, investment, trading, or other types of advice or recommendations supplied or endorsed by TradingView. Read more in the Terms of Use.