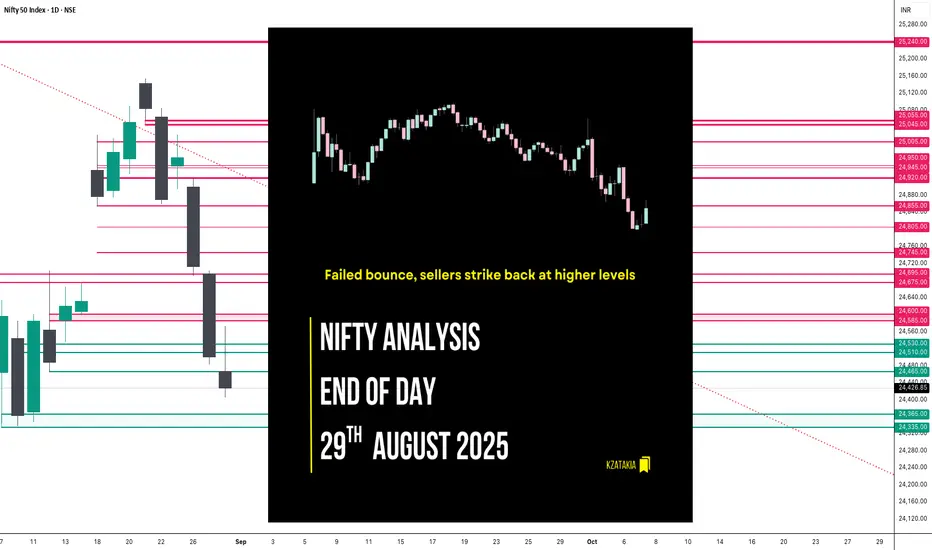
🟢 Nifty Analysis EOD – August 29, 2025 – Friday 🔴
Failed bounce, sellers strike back at higher levels
🗞 Nifty Summary
Nifty opened with a GapDown of 66 points but immediately started moving up with an OL formation (Open = Low at 24,466.60) — a sign of bullish intent.
The first 5-min range of 98 points set the IB (Initial Balance), marking Day Low = Open and Day High = 24,564.35.
Throughout the session, the index attempted multiple IB breakouts but they all turned into false moves until 2:30 PM, when Nifty finally broke down IB Low and tested 24,400 zone before closing weak at 24,426.85 (−74.05 / −0.30%).
This structure suggests bears are still in control, though signs of base-building are emerging.
🛡 5 Min Intraday Chart with Levels

📝 Intraday Walk
📉 Daily Time Frame Chart with Intraday Levels

🕯 Daily Candle Breakdown
🏗️ Structure Breakdown
🕯Candle Type
Rejection-style red candle with small body and long upper wick.
📚 Interpretation
🛡 5 Min Intraday Chart

⚔️ Gladiator Strategy Update
📌 Support & Resistance Levels
Resistance Zones:
Support Zones:
🔮 What’s Next? / Bias Direction
💭 Final Thoughts
“Markets don’t reverse in a single day – they build a base. Respect the levels, not the noise.”
✏️ Disclaimer
This is just my personal viewpoint. Always consult your financial advisor before taking any action.
Failed bounce, sellers strike back at higher levels
🗞 Nifty Summary
Nifty opened with a GapDown of 66 points but immediately started moving up with an OL formation (Open = Low at 24,466.60) — a sign of bullish intent.
The first 5-min range of 98 points set the IB (Initial Balance), marking Day Low = Open and Day High = 24,564.35.
Throughout the session, the index attempted multiple IB breakouts but they all turned into false moves until 2:30 PM, when Nifty finally broke down IB Low and tested 24,400 zone before closing weak at 24,426.85 (−74.05 / −0.30%).
This structure suggests bears are still in control, though signs of base-building are emerging.
🛡 5 Min Intraday Chart with Levels
📝 Intraday Walk
- GapDown start, but immediate OL formation = bullish sentiment
- Quick gap-filling attempt, but resistance capped upside near 24,564
- Multiple failed IB breakouts (both sides) = choppy action
- Post 2:30 PM → decisive IB Low breakdown toward 24,400
- Weak close at 24,426, below the midpoint of the day
📉 Daily Time Frame Chart with Intraday Levels
🕯 Daily Candle Breakdown
- Open: 24,466.70
- High: 24,572.45
- Low: 24,404.70
- Close: 24,426.85
- Change: −74.05 (−0.30%)
🏗️ Structure Breakdown
- Upper Wick (~105 pts): strong selling rejection at higher levels
- Lower Wick (~22 pts): weak buyer defense near lows
- Body (39.85 pts): indecisive but bearish bias
🕯Candle Type
Rejection-style red candle with small body and long upper wick.
📚 Interpretation
- Early rebound attempt failed.
- Close well below midpoint = sellers retain control.
- Candle resembles a Shooting Star (bearish context) → signals supply pressure at higher levels.
🛡 5 Min Intraday Chart
⚔️ Gladiator Strategy Update
- ATR: 201.12
- IB Range: 97.75 → Medium
- Market Structure: Balanced
- Trade Highlights: No trade signal triggered
📌 Support & Resistance Levels
Resistance Zones:
- 24,585 ~ 24,600
- 24,675 ~ 24,695
- 24,745
Support Zones:
- 24,665 ~ 24,650
- 24,365 ~ 24,335
🔮 What’s Next? / Bias Direction
- If 24,400 holds, short-term base formation could play out.
- If 24,400 breaks, expect further downside toward 24,250.
- Bias → Bearish continuation unless 24,600 is decisively reclaimed.
💭 Final Thoughts
“Markets don’t reverse in a single day – they build a base. Respect the levels, not the noise.”
✏️ Disclaimer
This is just my personal viewpoint. Always consult your financial advisor before taking any action.
Read my blogs here:
substack.com/@kzatakia
Follow me on Telegram:
t.me/swingtraderhub
Follow me on X:
x.com/kzatakia
substack.com/@kzatakia
Follow me on Telegram:
t.me/swingtraderhub
Follow me on X:
x.com/kzatakia
Related publications
Disclaimer
The information and publications are not meant to be, and do not constitute, financial, investment, trading, or other types of advice or recommendations supplied or endorsed by TradingView. Read more in the Terms of Use.