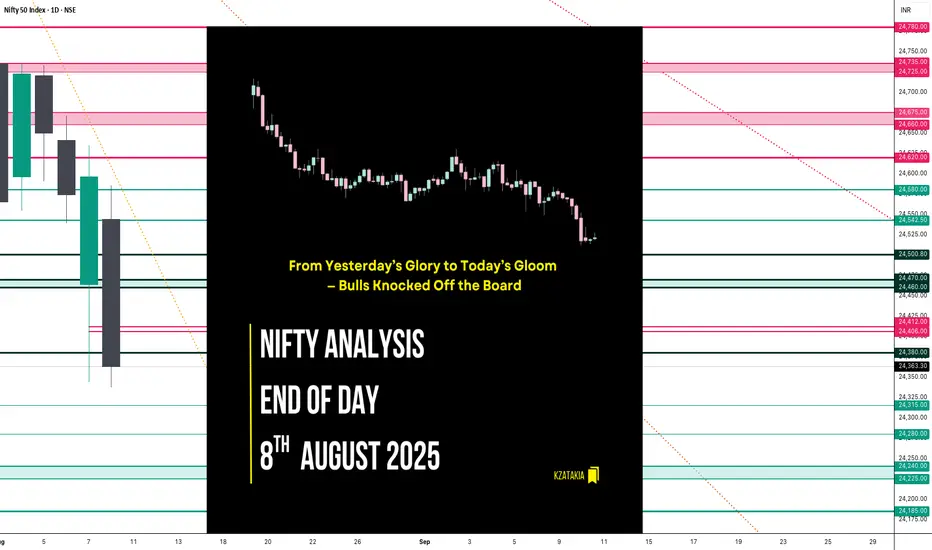
🟢 Nifty Analysis EOD – August 8, 2025 – Friday 🔴
From Yesterday’s Glory to Today’s Gloom — Bulls Knocked Off the Board
Today’s market was a textbook case of how quickly momentum can flip. Yesterday’s 289-point bullish surge was completely erased, with Nifty ending deep in the red and closing at the day’s low. Sellers clearly had the upper hand, leaving little room for bulls to breathe.
🗞 Nifty Summary
Friday opened with a 65-point gap-down — right below the crucial 24,580 support zone — and that level instantly showed rejection.
In the first 45 minutes, Nifty slipped 150 points from the day high and 200 points from the previous day high. The key Fibonacci retracement level from yesterday’s range — 24,406 ~ 24,412 — played the role of intraday savior multiple times, offering support and holding the market within a narrow zone for most of the day.
However, the bulls’ defense cracked after 3:00 PM. The support broke, triggering a sharp slide below 24,380 and even the Previous Day Low (PDL).
The upside was capped by 24,470 ~ 24,460, while 24,406 ~ 24,412 remained the battleground for most of the day until the breakdown.
In a single session, yesterday’s dramatic 289-point recovery rally was completely erased — with Nifty closing at the bottom of the PDL and CDL.
Today’s close is now below the low of 12th May, marking a 64-session (88-day) low.
Now the question for Monday: will bearish momentum extend, or will some positive news bring bulls back into play?
🛡 5 Min Intraday Chart with Levels

Intraday Walk
🔻 Gap-down open below major support at 24580.
⏳ First 45 minutes: Steep drop of 150 points from the day high.
🛡️ Fib support at 24406–24412 holds multiple times… until the late break.
🔻 Post 3 PM: Support collapse leads to fresh lows below PDL.
📉 Close near day’s low — erasing yesterday’s bullish rally.
📉 Daily Time Frame Chart with Intraday Levels

🕯 Daily Candle Breakdown
Structure:
Real Body: 180.95 pts (Red Candle — Close < Open)
Upper Wick: 41.25 pts
Lower Wick: 25.80 pts
Interpretation:
Strong bearish sentiment — sellers maintained control from open to close.
Very small lower wick — indicates conviction from sellers in closing near the low.
Wiped out prior day’s gains — buyers have lost the short-term edge.
Candle Type:
Bearish Marubozu (near-full body) — signals decisive selling pressure, often a continuation pattern after weakness.
🛡 5 Min Intraday Chart

🥷 Gladiator Strategy Update
ATR: 210.45
IB Range: 134.05 → Medium
Market Structure: Balanced
Trade Summary:
10:35 AM – Short Entry → SL Hit
📌 What’s Next? / Bias Direction
Below 24,400: Bearish momentum likely to extend toward 24,250–24,200.
Above 24,470: Only a strong reclaim can shift bias back to neutral.
Gap-down/weak open on Monday may accelerate selling; bounce attempts will face resistance at 24,400–24,470.
🔍 Support & Resistance Levels
Resistance Zones:
Support Zones:
💬 Final Thoughts
"Markets don’t turn on hope — they turn on price. Respect the levels, and let price lead the story."
Bulls had the glory on Thursday, but Friday flipped the script completely. The market now sits at a multi-month low — momentum favors bears, but Monday’s open will decide if we see follow-through selling or a sharp dead-cat bounce.
✏️ Disclaimer
This is just my personal viewpoint. Always consult your financial advisor before taking any action.
From Yesterday’s Glory to Today’s Gloom — Bulls Knocked Off the Board
Today’s market was a textbook case of how quickly momentum can flip. Yesterday’s 289-point bullish surge was completely erased, with Nifty ending deep in the red and closing at the day’s low. Sellers clearly had the upper hand, leaving little room for bulls to breathe.
🗞 Nifty Summary
Friday opened with a 65-point gap-down — right below the crucial 24,580 support zone — and that level instantly showed rejection.
In the first 45 minutes, Nifty slipped 150 points from the day high and 200 points from the previous day high. The key Fibonacci retracement level from yesterday’s range — 24,406 ~ 24,412 — played the role of intraday savior multiple times, offering support and holding the market within a narrow zone for most of the day.
However, the bulls’ defense cracked after 3:00 PM. The support broke, triggering a sharp slide below 24,380 and even the Previous Day Low (PDL).
The upside was capped by 24,470 ~ 24,460, while 24,406 ~ 24,412 remained the battleground for most of the day until the breakdown.
In a single session, yesterday’s dramatic 289-point recovery rally was completely erased — with Nifty closing at the bottom of the PDL and CDL.
Today’s close is now below the low of 12th May, marking a 64-session (88-day) low.
Now the question for Monday: will bearish momentum extend, or will some positive news bring bulls back into play?
🛡 5 Min Intraday Chart with Levels
Intraday Walk
🔻 Gap-down open below major support at 24580.
⏳ First 45 minutes: Steep drop of 150 points from the day high.
🛡️ Fib support at 24406–24412 holds multiple times… until the late break.
🔻 Post 3 PM: Support collapse leads to fresh lows below PDL.
📉 Close near day’s low — erasing yesterday’s bullish rally.
📉 Daily Time Frame Chart with Intraday Levels
🕯 Daily Candle Breakdown
- Open: 24,544.25
- High: 24,585.50
- Low: 24,337.50
- Close: 24,363.30
- Change: −232.85 (−0.95%)
Structure:
Real Body: 180.95 pts (Red Candle — Close < Open)
Upper Wick: 41.25 pts
Lower Wick: 25.80 pts
Interpretation:
Strong bearish sentiment — sellers maintained control from open to close.
Very small lower wick — indicates conviction from sellers in closing near the low.
Wiped out prior day’s gains — buyers have lost the short-term edge.
Candle Type:
Bearish Marubozu (near-full body) — signals decisive selling pressure, often a continuation pattern after weakness.
🛡 5 Min Intraday Chart
🥷 Gladiator Strategy Update
ATR: 210.45
IB Range: 134.05 → Medium
Market Structure: Balanced
Trade Summary:
10:35 AM – Short Entry → SL Hit
📌 What’s Next? / Bias Direction
Below 24,400: Bearish momentum likely to extend toward 24,250–24,200.
Above 24,470: Only a strong reclaim can shift bias back to neutral.
Gap-down/weak open on Monday may accelerate selling; bounce attempts will face resistance at 24,400–24,470.
🔍 Support & Resistance Levels
Resistance Zones:
- 24,406 ~ 24,412
- 24,460 ~ 24,470
- 24,500
- 24,580
Support Zones:
- 24,315
- 24,280
- 24,240 ~ 24,225
- 24,185
💬 Final Thoughts
"Markets don’t turn on hope — they turn on price. Respect the levels, and let price lead the story."
Bulls had the glory on Thursday, but Friday flipped the script completely. The market now sits at a multi-month low — momentum favors bears, but Monday’s open will decide if we see follow-through selling or a sharp dead-cat bounce.
✏️ Disclaimer
This is just my personal viewpoint. Always consult your financial advisor before taking any action.
Read my blogs here:
substack.com/@kzatakia
Follow me on Telegram:
t.me/swingtraderhub
Follow me on X:
x.com/kzatakia
substack.com/@kzatakia
Follow me on Telegram:
t.me/swingtraderhub
Follow me on X:
x.com/kzatakia
Related publications
Disclaimer
The information and publications are not meant to be, and do not constitute, financial, investment, trading, or other types of advice or recommendations supplied or endorsed by TradingView. Read more in the Terms of Use.