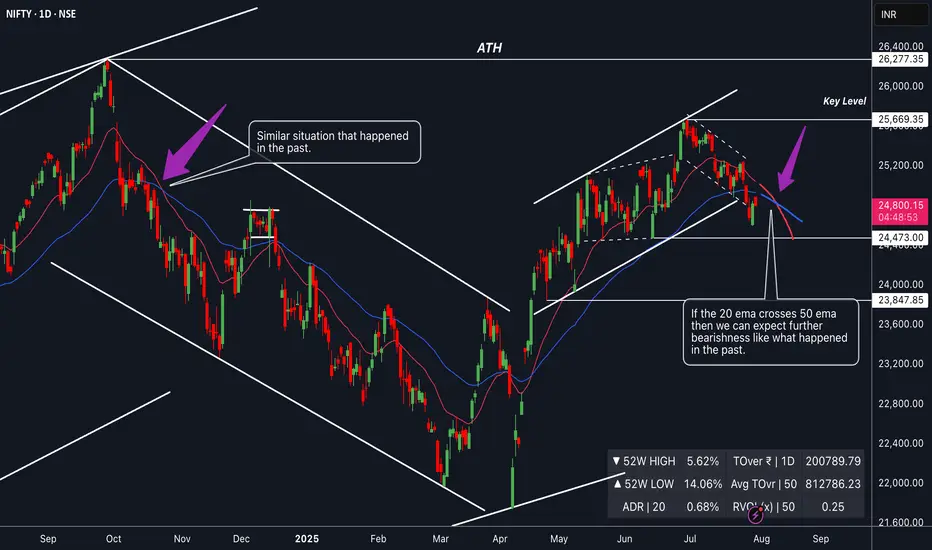
The 20 EMA is inching dangerously close to crossing below the 50 EMA on the daily chart — a key technical zone that often signals the start of a short-term downtrend.
📉 What this setup could mean:
Momentum is fading, and bulls are losing grip.
A confirmed crossover may invite fresh selling pressure.
Price structure already showing signs of weakness.
🔍 What to watch:
A clear 20 EMA < 50 EMA crossover with a bearish candle close.
Increased volume on red days could validate the move.
Retest of key support zones if crossover plays out.
⚠️ This is a high-probability setup, but not a confirmation yet. Keep alerts set — the next few candles could decide the trend!
📢📢📢
Disclaimer : The analysis shared here is for informational purposes only and should not be considered as financial advice. Trading in all markets carries inherent risks, and past performance is not indicative of future results. It’s essential to conduct your own research and assess your risk tolerance before making any investment decisions. The views expressed in this analysis are solely mine. It’s important to note that I am not a SEBI registered analyst, so the analysis provided does not constitute formal investment advice under SEBI regulations.
📉 What this setup could mean:
Momentum is fading, and bulls are losing grip.
A confirmed crossover may invite fresh selling pressure.
Price structure already showing signs of weakness.
🔍 What to watch:
A clear 20 EMA < 50 EMA crossover with a bearish candle close.
Increased volume on red days could validate the move.
Retest of key support zones if crossover plays out.
⚠️ This is a high-probability setup, but not a confirmation yet. Keep alerts set — the next few candles could decide the trend!
📢📢📢
If my perspective changes or if I gather additional fundamental data that influences my views, I will provide updates accordingly.
Thank you for following along with this journey, and I remain committed to sharing insights and updates as my trading strategy evolves. As always, please feel free to reach out with any questions or comments.
Other posts related to this particular position and scrip, if any, will be attached underneath. Do check those out too.
Disclaimer : The analysis shared here is for informational purposes only and should not be considered as financial advice. Trading in all markets carries inherent risks, and past performance is not indicative of future results. It’s essential to conduct your own research and assess your risk tolerance before making any investment decisions. The views expressed in this analysis are solely mine. It’s important to note that I am not a SEBI registered analyst, so the analysis provided does not constitute formal investment advice under SEBI regulations.
Disclaimer
The information and publications are not meant to be, and do not constitute, financial, investment, trading, or other types of advice or recommendations supplied or endorsed by TradingView. Read more in the Terms of Use.
Disclaimer
The information and publications are not meant to be, and do not constitute, financial, investment, trading, or other types of advice or recommendations supplied or endorsed by TradingView. Read more in the Terms of Use.