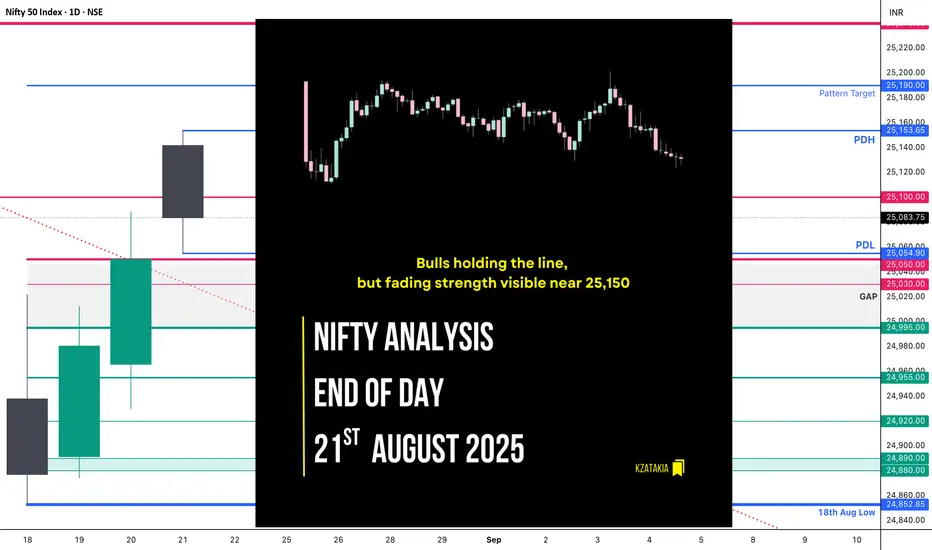
🟢 Nifty Analysis EOD – August 21, 2025 – Thursday 🔴
Bulls holding the line, but fading strength visible near 25,150
🗞 Nifty Summary
Nifty opened with a gap-up of 98 points at 25,144.85, continuing its bullish tone above the previous day’s high. But from the very first tick, it slipped lower to fill the gap and found support at 25,055, where it formed the IB range. A sharp recovery took it back toward the open, but multiple attempts failed to cross Day Open / Day High / IB High.
Around 2:15 pm, another breakout attempt was strongly rejected, pushing the index below the PDH, and Nifty finally closed at 25,076.95.
Though the close is higher by +33 points vs the previous day, it left behind a red daily candle (close < open). This indicates fading bullish momentum, even though HH-HL structure is still intact.
The range was narrow (≈98 points), categorising the day as range-bound, not sideways. The previous weekly expiry was also narrow yet sideways.
🛡 5 Min Intraday Chart with Levels

🛡 Intraday Walk
📉 Daily Time Frame Chart with Intraday Levels

🕯 Daily Candle Breakdown
🏗️ Structure Breakdown
📚 Interpretation
🕯️ Candle Type
Small bearish body with lower tail → selling pressure at top, hidden demand at support.
🛡 5 Min Intraday Chart

🛡Gladiator Strategy Update
🕵️ Range & Bias
📌 Support & Resistance Levels
🎚️ Resistance Zones
🎚️ Support Zones
💡 Final Thoughts
The market is respecting 25,050 as demand and 25,150 as supply, leaving price action compressed in a tight zone. Bulls are still holding ground, but repeated failures near resistance hint at fading strength.
📌 “Markets often whisper before they roar — repeated rejections are the whisper, the breakout will be the roar.”
✏️ Disclaimer
This is my personal analysis — not investment advice. Please consult your financial advisor before trading.
Bulls holding the line, but fading strength visible near 25,150
🗞 Nifty Summary
Nifty opened with a gap-up of 98 points at 25,144.85, continuing its bullish tone above the previous day’s high. But from the very first tick, it slipped lower to fill the gap and found support at 25,055, where it formed the IB range. A sharp recovery took it back toward the open, but multiple attempts failed to cross Day Open / Day High / IB High.
Around 2:15 pm, another breakout attempt was strongly rejected, pushing the index below the PDH, and Nifty finally closed at 25,076.95.
Though the close is higher by +33 points vs the previous day, it left behind a red daily candle (close < open). This indicates fading bullish momentum, even though HH-HL structure is still intact.
The range was narrow (≈98 points), categorising the day as range-bound, not sideways. The previous weekly expiry was also narrow yet sideways.
🛡 5 Min Intraday Chart with Levels
🛡 Intraday Walk
- Gap-up opening at 25,144.85, above PDH → bullish continuation vibe.
- Early dip → support at 25,055 → IB formed.
- Recovery attempt back to day’s open, but rejection at 25,150 zone.
- Second breakout attempt at 2:15 pm → harder rejection.
- Index slipped below PDH → closed at 25,076.95, above support.
📉 Daily Time Frame Chart with Intraday Levels
🕯 Daily Candle Breakdown
- Open: 25,142.00
- High: 25,153.65
- Low: 25,054.90
- Close: 25,083.75
- Change: +33.20 (+0.13%)
🏗️ Structure Breakdown
- Red candle (Close < Open)
- Body: 58.25 points
- Upper wick: 11.65 points
- Lower wick: 28.85 points
📚 Interpretation
- Sellers defended 25,150 again.
- Close still above 25,050 → buyers alive.
- Lower wick shows dip-buying at 25,055.
- Net effect: Mild profit booking, not a reversal.
🕯️ Candle Type
Small bearish body with lower tail → selling pressure at top, hidden demand at support.
🛡 5 Min Intraday Chart
🛡Gladiator Strategy Update
- ATR: 195.14
- IB Range: 89.95 → Medium
- Market Structure: ImBalanced
- Trade Highlight: No trade trigger today.
🕵️ Range & Bias
- Support Zone: 24,955 – 24,920
- Resistance Zone: 25,100 – 25,140
- Bias: Cautiously Bullish → above 25k, but conviction is weak.
📌 Support & Resistance Levels
🎚️ Resistance Zones
- 25,100
- 25,155
- 25,190 (pattern target)
- 25,240
🎚️ Support Zones
- 25,050 ~ 25,030
- 24,995
- 24,955
- 24,920
- 24,890 – 24,880
💡 Final Thoughts
The market is respecting 25,050 as demand and 25,150 as supply, leaving price action compressed in a tight zone. Bulls are still holding ground, but repeated failures near resistance hint at fading strength.
📌 “Markets often whisper before they roar — repeated rejections are the whisper, the breakout will be the roar.”
✏️ Disclaimer
This is my personal analysis — not investment advice. Please consult your financial advisor before trading.
Read my blogs here:
substack.com/@kzatakia
Follow me on Telegram:
t.me/swingtraderhub
Follow me on X:
x.com/kzatakia
substack.com/@kzatakia
Follow me on Telegram:
t.me/swingtraderhub
Follow me on X:
x.com/kzatakia
Related publications
Disclaimer
The information and publications are not meant to be, and do not constitute, financial, investment, trading, or other types of advice or recommendations supplied or endorsed by TradingView. Read more in the Terms of Use.