🟢 Nifty Analysis EOD – June 11, 2025 – Wednesday 🔴
♻️ Déjà vu Day – Bulls Attempt, Bears Resist
For the third consecutive session, Nifty started on a positive note with a 45-point gap-up at 25,134.15, but as has been the pattern lately, early optimism was wiped out instantly, with the index hitting the day’s low of 25,081 within the first 5 minutes.
What followed was a gradual climb as bulls gained some momentum, pushing Nifty to test the 25,200 zone. However, resistance in the 25,200–25,222 band proved too strong. Despite multiple attempts, bulls gave up the level around 13:20, triggering a sharp fall to 25,100.
Post-fall, the market struggled to recover and closed at 25,141.40, up just 37 points from the previous close. It was yet another rangebound, indecisive session, showing that the index is coiling for a potential breakout—but the direction remains uncertain.
🛡 5 Min Chart with Levels

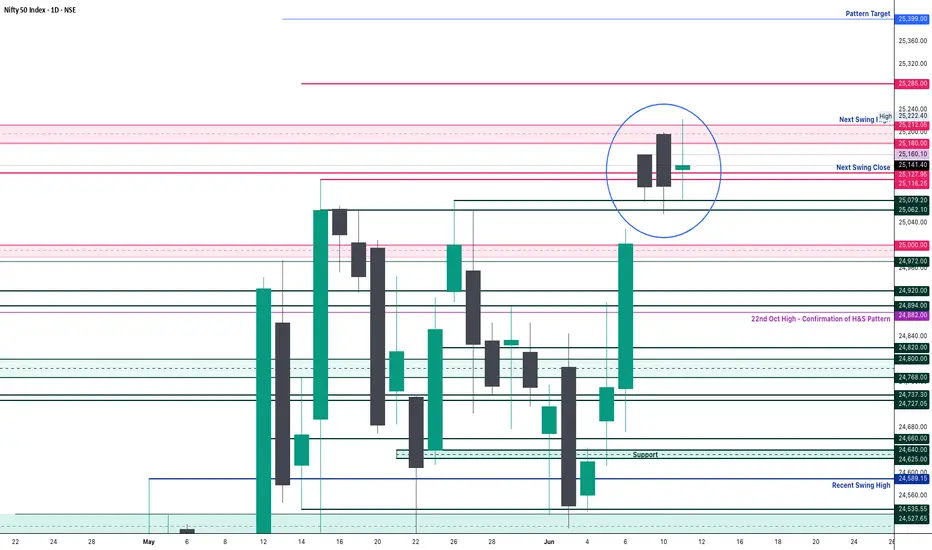
🕯 Daily Time Frame Chart

🕯 Daily Candle Breakdown
Open: 25,134.15
High: 25,222.40
Low: 25,081.30
Close: 25,141.40
Net Change: +37.15 (+0.15%)
📊 Candle Structure Breakdown
Real Body: 7.25 pts → 🟢 Small Green Candle
Upper Wick: 81.00 pts
Lower Wick: 52.85 pts
🔍 Interpretation
Strong intra-day swings in both directions signal high volatility with no control on either side.
Bulls failed at resistance (25,222); bears couldn’t break support (25,081).
The tiny real body with long shadows reflects market indecision.
🔦 Candle Type
⚖️ Spinning Top– Neutral structure with no clear directional conviction.
📌 Key Insight
The market is clearly taking a breather after recent moves.
Watch 25,222 on the upside and 25,080 on the downside — a breakout from either could set the next directional tone.
Bias stays mildly bullish as long as 25,080 holds, but it’s hanging by a thread.
🛡 5 Min Intraday Chart

⚔️ Gladiator Strategy Update
ATR: 239.75
IB Range: 72.9 → Small IB
Market Structure: Balanced
Trades:✅ 10:30 AM – Long Triggered → Target Achieved, Trailing SL Hit (RR: 1:1.65)
📌 Support & Resistance Zones
Resistance Levels
25,116 ~ 25,128
25,180 ~ 25,222
25,285
Support Levels
25,062 ~ 25,070
24,972
24,920 ~ 24,894
24,800 ~ 24,768
💭 Final Thoughts
Market is in a tight tug-of-war. No clear winner yet, but momentum can build quickly once a side gives in.Patience will pay—wait for the range breakout.
🧠 "Pressure builds silently before an explosion—so does the market before a breakout."
✏️ Disclaimer
This is just my personal viewpoint. Always consult your financial advisor before taking any action.
♻️ Déjà vu Day – Bulls Attempt, Bears Resist
For the third consecutive session, Nifty started on a positive note with a 45-point gap-up at 25,134.15, but as has been the pattern lately, early optimism was wiped out instantly, with the index hitting the day’s low of 25,081 within the first 5 minutes.
What followed was a gradual climb as bulls gained some momentum, pushing Nifty to test the 25,200 zone. However, resistance in the 25,200–25,222 band proved too strong. Despite multiple attempts, bulls gave up the level around 13:20, triggering a sharp fall to 25,100.
Post-fall, the market struggled to recover and closed at 25,141.40, up just 37 points from the previous close. It was yet another rangebound, indecisive session, showing that the index is coiling for a potential breakout—but the direction remains uncertain.
🛡 5 Min Chart with Levels
🕯 Daily Time Frame Chart
🕯 Daily Candle Breakdown
Open: 25,134.15
High: 25,222.40
Low: 25,081.30
Close: 25,141.40
Net Change: +37.15 (+0.15%)
📊 Candle Structure Breakdown
Real Body: 7.25 pts → 🟢 Small Green Candle
Upper Wick: 81.00 pts
Lower Wick: 52.85 pts
🔍 Interpretation
Strong intra-day swings in both directions signal high volatility with no control on either side.
Bulls failed at resistance (25,222); bears couldn’t break support (25,081).
The tiny real body with long shadows reflects market indecision.
🔦 Candle Type
⚖️ Spinning Top– Neutral structure with no clear directional conviction.
📌 Key Insight
The market is clearly taking a breather after recent moves.
Watch 25,222 on the upside and 25,080 on the downside — a breakout from either could set the next directional tone.
Bias stays mildly bullish as long as 25,080 holds, but it’s hanging by a thread.
🛡 5 Min Intraday Chart
⚔️ Gladiator Strategy Update
ATR: 239.75
IB Range: 72.9 → Small IB
Market Structure: Balanced
Trades:✅ 10:30 AM – Long Triggered → Target Achieved, Trailing SL Hit (RR: 1:1.65)
📌 Support & Resistance Zones
Resistance Levels
25,116 ~ 25,128
25,180 ~ 25,222
25,285
Support Levels
25,062 ~ 25,070
24,972
24,920 ~ 24,894
24,800 ~ 24,768
💭 Final Thoughts
Market is in a tight tug-of-war. No clear winner yet, but momentum can build quickly once a side gives in.Patience will pay—wait for the range breakout.
🧠 "Pressure builds silently before an explosion—so does the market before a breakout."
✏️ Disclaimer
This is just my personal viewpoint. Always consult your financial advisor before taking any action.
Read my blogs here:
substack.com/@kzatakia
Follow me on Telegram:
t.me/swingtraderhub
Follow me on X:
x.com/kzatakia
substack.com/@kzatakia
Follow me on Telegram:
t.me/swingtraderhub
Follow me on X:
x.com/kzatakia
Related publications
Disclaimer
The information and publications are not meant to be, and do not constitute, financial, investment, trading, or other types of advice or recommendations supplied or endorsed by TradingView. Read more in the Terms of Use.