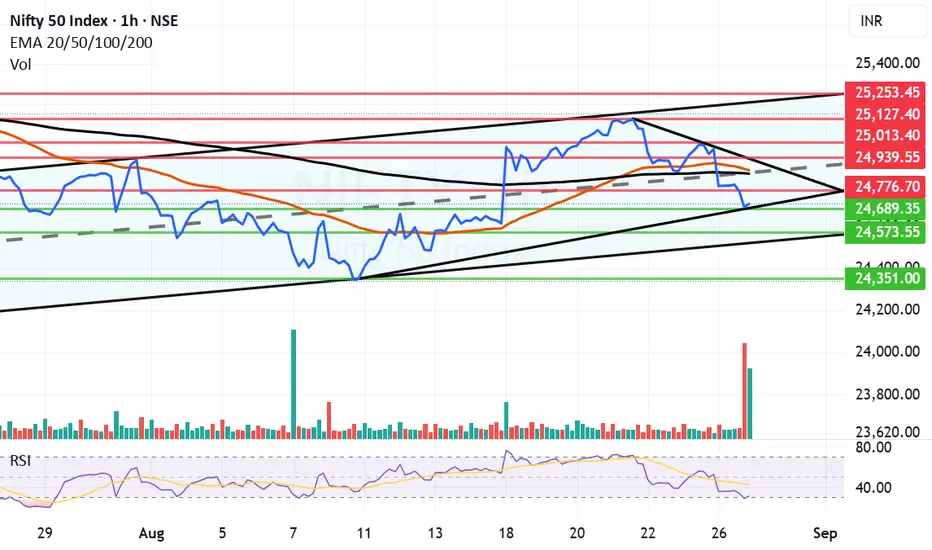
Nifty nose dived more than 1% today as the deadline for additional Tariff implementation has arrived. With a market holiday tomorrow investor shorted their positions. The supports for Nifty travelling in the hourly parallel channel which is shown in the chart seem to be at 24689 and 24573. If we get a closing below 24573 then Nifty can fall further to 24351 or below. We are in the zone from where historical RSI support as you can see in the chart. This makes it possible for Nifty to fight back on Thursday and Friday if things go well on Political front and there is no further bad news.
In the scenario of Nifty fighting back the resistance for Nifty seems to be at 24776. If we get a closing above 24776 then there is a triple strong resistance zone between 24850 and 24939. This zone consists of 4 strong resistances which are mid-channel resistance, Mother line of hourly chart, father line of hourly chart and finally trend line resistance. Once we get a closing above 24939 the future resistances will be at 25013, 25127 and finally 25253. Above 25253 closing Bulls will be back in business.
Disclaimer: The above information is provided for educational purpose, analysis and paper trading only. Please don't treat this as a buy or sell recommendation for the stock or index. The Techno-Funda analysis is based on data that is more than 3 months old. Supports and Resistances are determined by historic past peaks and Valley in the chart. Many other indicators and patterns like EMA, RSI, MACD, Volumes, Fibonacci, parallel channel etc. use historic data which is 3 months or older cyclical points. There is no guarantee they will work in future as markets are highly volatile and swings in prices are also due to macro and micro factors based on actions taken by the company as well as region and global events. Equity investment is subject to risks. I or my clients or family members might have positions in the stocks that we mention in our educational posts. We will not be responsible for any Profit or loss that may occur due to any financial decision taken based on any data provided in this message. Do consult your investment advisor before taking any financial decisions. Stop losses should be an important part of any investment in equity.
Disclaimer
The information and publications are not meant to be, and do not constitute, financial, investment, trading, or other types of advice or recommendations supplied or endorsed by TradingView. Read more in the Terms of Use.
Disclaimer
The information and publications are not meant to be, and do not constitute, financial, investment, trading, or other types of advice or recommendations supplied or endorsed by TradingView. Read more in the Terms of Use.