NIFTY 50 INDEX CHART ANALYSIS FOR INTRADAY.
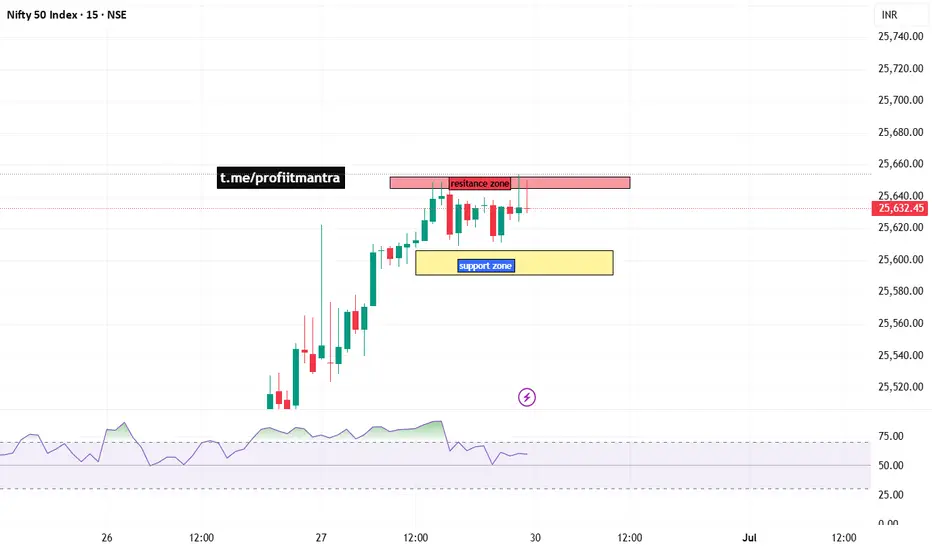
here we are seeing of nifty 50 index chart, and one is resistance and one box is support that is yellow color and if price will come to support and then we will try to find of buy opportunity. if support zone breaks then we will plan for sell of nifty and if break of resistance, then we will see big rally.
here we are seeing of nifty 50 index chart, and one is resistance and one box is support that is yellow color and if price will come to support and then we will try to find of buy opportunity. if support zone breaks then we will plan for sell of nifty and if break of resistance, then we will see big rally.
Related publications
Disclaimer
The information and publications are not meant to be, and do not constitute, financial, investment, trading, or other types of advice or recommendations supplied or endorsed by TradingView. Read more in the Terms of Use.
Related publications
Disclaimer
The information and publications are not meant to be, and do not constitute, financial, investment, trading, or other types of advice or recommendations supplied or endorsed by TradingView. Read more in the Terms of Use.