🟢 Nifty Analysis EOD – July 22, 2025 – Tuesday 🔴
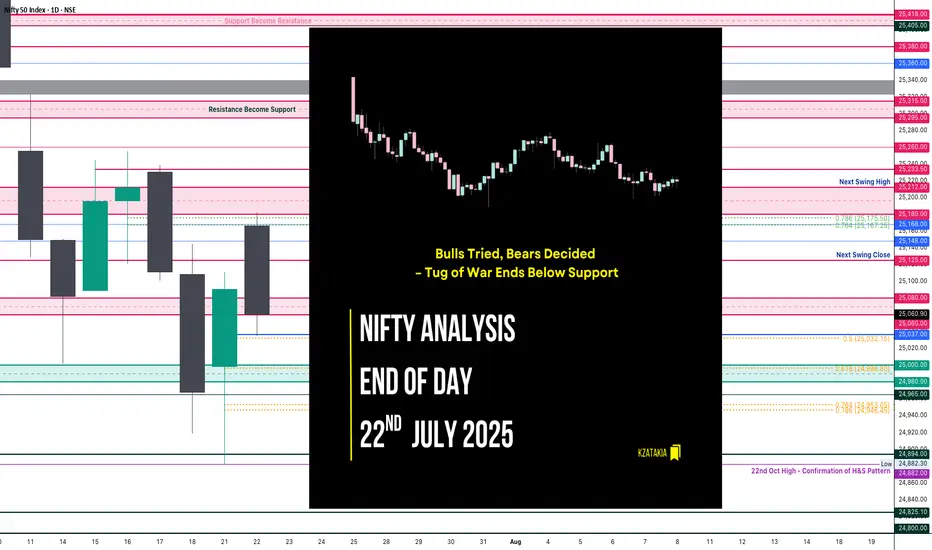
"Bulls Tried, Bears Decided – Tug of War Ends Below Support"
Nifty opened with an 88-point gap-up, continuing the bullish sentiment, right at the resistance zone of 25,180 ~ 25,212. However, the market opened at the high (OH) and quickly slipped around 100 points to form the Initial Balance (IB). After a brief bounce back to the mean, it faced resistance, leading to a breakdown of IB and further losses of 77 points.
A supportive bounce emerged near 25,060 ~ 25,080, but the price was pushed down again by PDH + VWAP + R1. The day closed below PDC and under the support zone at 25,065, showing bearish dominance despite a volatile tug-of-war between bulls and bears.
Today’s low tested the 0.5 Fibonacci retracement level (from yesterday’s low to today’s high). If this is truly a retracement, 25K must hold in upcoming sessions, and bulls will need to reclaim 25,200 to regain their grip.
🕯 5 Min Time Frame Chart with Intraday Levels

🕯 Daily Time Frame Chart with Intraday Levels

📊 Daily Candle Breakdown
Open: 25,166.65
High: 25,182.00
Low: 25,035.55
Close: 25,060.90
Change: −29.80 (−0.12%)
Candle Structure:
Real Body: Red (−105.75 pts) → Decent bearish body
Upper Wick: 15.35 pts → Small
Lower Wick: 25.35 pts → Moderate
Interpretation:
Price opened strong but faced selling near 25,180, leading to a steady drop throughout the session. The lower wick shows some buying attempt near 25,035, but the close below open signals bears dominated.
Candle Type:
Bearish candle with moderate lower wick – resembles a Bearish Engulfing setup after a green candle, suggesting profit-booking or fresh selling.
Key Insight:
Sellers defending 25,180–25,200 firmly
Holding above 25,030–25,050 is critical; breaking this could retest 24,950–25,000
Bulls must reclaim 25,120–25,150 for momentum revival
🛡 5 Min Intraday Chart

⚔️ Gladiator Strategy Update
ATR: 182.32
IB Range: 92.6 → Medium
Market Structure: Balanced
Trades Triggered:
10:45 AM – Short Trade → Trailing SL Hit (1:0.8)
12:45 PM – Long Trade → SL Hit
📌 Support & Resistance Levels
Resistance:
Support:
🧠 Final Thoughts:
"Markets often dance between zones of power — where bulls flex and bears press. It's not chaos, it's the choreography of sentiment."
The 25,000–25,212 zone continues to be the battlefield. Let’s see who seizes the upper hand tomorrow.
✏️ Disclaimer:
This is just my personal viewpoint. Always consult your financial advisor before taking any action.
"Bulls Tried, Bears Decided – Tug of War Ends Below Support"
Nifty opened with an 88-point gap-up, continuing the bullish sentiment, right at the resistance zone of 25,180 ~ 25,212. However, the market opened at the high (OH) and quickly slipped around 100 points to form the Initial Balance (IB). After a brief bounce back to the mean, it faced resistance, leading to a breakdown of IB and further losses of 77 points.
A supportive bounce emerged near 25,060 ~ 25,080, but the price was pushed down again by PDH + VWAP + R1. The day closed below PDC and under the support zone at 25,065, showing bearish dominance despite a volatile tug-of-war between bulls and bears.
Today’s low tested the 0.5 Fibonacci retracement level (from yesterday’s low to today’s high). If this is truly a retracement, 25K must hold in upcoming sessions, and bulls will need to reclaim 25,200 to regain their grip.
🕯 5 Min Time Frame Chart with Intraday Levels
🕯 Daily Time Frame Chart with Intraday Levels
📊 Daily Candle Breakdown
Open: 25,166.65
High: 25,182.00
Low: 25,035.55
Close: 25,060.90
Change: −29.80 (−0.12%)
Candle Structure:
Real Body: Red (−105.75 pts) → Decent bearish body
Upper Wick: 15.35 pts → Small
Lower Wick: 25.35 pts → Moderate
Interpretation:
Price opened strong but faced selling near 25,180, leading to a steady drop throughout the session. The lower wick shows some buying attempt near 25,035, but the close below open signals bears dominated.
Candle Type:
Bearish candle with moderate lower wick – resembles a Bearish Engulfing setup after a green candle, suggesting profit-booking or fresh selling.
Key Insight:
Sellers defending 25,180–25,200 firmly
Holding above 25,030–25,050 is critical; breaking this could retest 24,950–25,000
Bulls must reclaim 25,120–25,150 for momentum revival
🛡 5 Min Intraday Chart
⚔️ Gladiator Strategy Update
ATR: 182.32
IB Range: 92.6 → Medium
Market Structure: Balanced
Trades Triggered:
10:45 AM – Short Trade → Trailing SL Hit (1:0.8)
12:45 PM – Long Trade → SL Hit
📌 Support & Resistance Levels
Resistance:
- 25,080 ~ 25,060
- 25,125
- 25,168
- 25,180 ~ 25,212
Support:
- 25,037
- 25,000 ~ 24,980
- 24,965
- 24,894 ~ 24,882
- 24,825
- 24,800 ~ 24,768
🧠 Final Thoughts:
"Markets often dance between zones of power — where bulls flex and bears press. It's not chaos, it's the choreography of sentiment."
The 25,000–25,212 zone continues to be the battlefield. Let’s see who seizes the upper hand tomorrow.
✏️ Disclaimer:
This is just my personal viewpoint. Always consult your financial advisor before taking any action.
Read my blogs here:
substack.com/@kzatakia
Follow me on Telegram:
t.me/swingtraderhub
Follow me on X:
x.com/kzatakia
substack.com/@kzatakia
Follow me on Telegram:
t.me/swingtraderhub
Follow me on X:
x.com/kzatakia
Related publications
Disclaimer
The information and publications are not meant to be, and do not constitute, financial, investment, trading, or other types of advice or recommendations supplied or endorsed by TradingView. Read more in the Terms of Use.