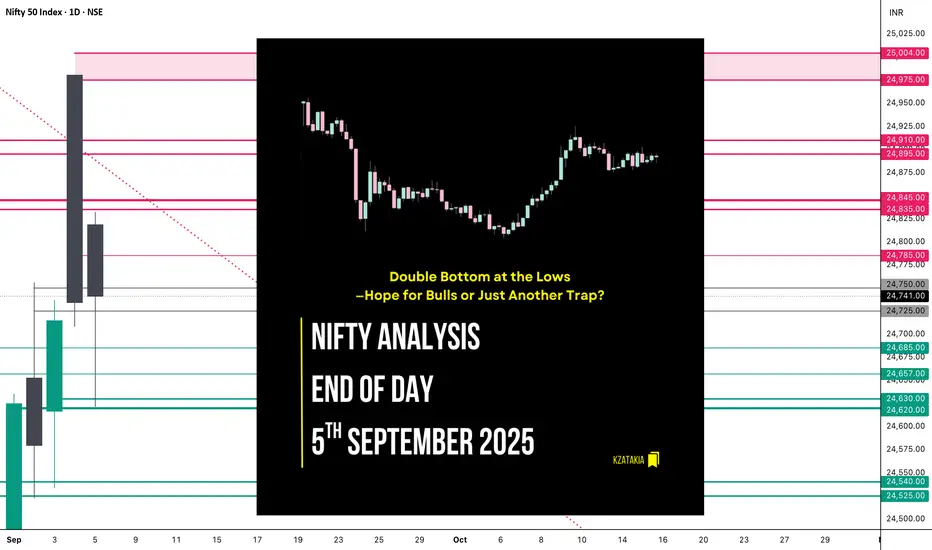
🟢 Nifty Analysis EOD – September 5, 2025 – Friday 🔴
Double Bottom at the Lows—Hope for Bulls or Just Another Trap?
🗞 Nifty Summary
Nifty opened with a 98-point gap-up at 24,825 but showed hesitation, spending the first 45 minutes stuck in the CPR zone within a narrow 60-point band. By 10 AM, the index slipped sharply—breaking both IB Low and BC level, and within minutes also pierced PDL, tumbling nearly 143 points. Support emerged at S1 (24,635), where the fall finally halted.
The index then spent over two hours base-building between PDL and S1, forming a double bottom (Adam–Eve) pattern. Once this base broke out above PDL, the index rallied quickly, meeting its upside target.
Structurally, the session shaped into a triple distribution day:
Intraday option traders found strong opportunities with fast 2x expansion off a small IB, but swing traders likely struggled with whipsaws.
Closing nearly flat at 24,741 (+6.7 pts) keeps the directional dilemma alive. Yesterday’s rejection repeated today—but the 125-point recovery off lows and close above PDL gives bulls a glimmer of hope.
🛡 5 Min Intraday Chart with Levels

📉 Daily Time Frame Chart with Intraday Levels

🕯 Daily Candle Breakdown
🏗️ Structure Breakdown
🕯Candle Type
Hammer / Pin Bar → indicates potential reversal with bullish undertone.
📚 Interpretation
🔍 Short-Term View – September 8, 2025
> If 24,620 breaks, weakness could extend to 24,450.
> If 24,830 sustains, bulls may regain the upper hand.
🛡 5 Min Intraday Chart

⚔️ Gladiator Strategy Update
1) 10:00 AM – Short Trigger → Target Hit (R:R = 1:3.64)
📌 Support & Resistance Levels
Resistance Zones:
Support Zones:
💡 Final Thoughts
Today’s Hammer at the lows signals that buyers are quietly absorbing supply. But conviction remains missing—two back-to-back sessions show indecision at higher levels. Until either 24,620 breaks or 24,830 is sustained, expect choppy action favoring intraday trades over positional setups.
📖 “Reversals don’t start with noise—they begin with defense at key levels.”
✏️ Disclaimer
This is just my personal viewpoint. Always consult your financial advisor before taking any action.
Double Bottom at the Lows—Hope for Bulls or Just Another Trap?
🗞 Nifty Summary
Nifty opened with a 98-point gap-up at 24,825 but showed hesitation, spending the first 45 minutes stuck in the CPR zone within a narrow 60-point band. By 10 AM, the index slipped sharply—breaking both IB Low and BC level, and within minutes also pierced PDL, tumbling nearly 143 points. Support emerged at S1 (24,635), where the fall finally halted.
The index then spent over two hours base-building between PDL and S1, forming a double bottom (Adam–Eve) pattern. Once this base broke out above PDL, the index rallied quickly, meeting its upside target.
Structurally, the session shaped into a triple distribution day:
- Early selling phase,
- Midday consolidation,
- Late recovery rally.
Intraday option traders found strong opportunities with fast 2x expansion off a small IB, but swing traders likely struggled with whipsaws.
Closing nearly flat at 24,741 (+6.7 pts) keeps the directional dilemma alive. Yesterday’s rejection repeated today—but the 125-point recovery off lows and close above PDL gives bulls a glimmer of hope.
🛡 5 Min Intraday Chart with Levels
📉 Daily Time Frame Chart with Intraday Levels
🕯 Daily Candle Breakdown
- Open: 24,818.85
- High: 24,832.35
- Low: 24,621.60
- Close: 24,741.00
- Change: +6.70 (+0.03%)
🏗️ Structure Breakdown
- Red candle (Close < Open), but still slightly positive vs. previous day.
- Body: 77.85 pts → small bearish body.
- Upper wick: 13.50 pts → negligible.
- Lower wick: 119.40 pts → long tail.
🕯Candle Type
Hammer / Pin Bar → indicates potential reversal with bullish undertone.
📚 Interpretation
- Market slipped nearly 200 pts intraday but bounced back strongly.
- Long downside tail reflects demand defense at 24,620–24,635 zone.
- Despite red body, price action leans neutral-to-bullish.
🔍 Short-Term View – September 8, 2025
- Support: 24,620 (defended low).
- Resistance: 24,830–24,980 (recent rejection zone).
- 👉 Bias Direction:
> If 24,620 breaks, weakness could extend to 24,450.
> If 24,830 sustains, bulls may regain the upper hand.
🛡 5 Min Intraday Chart
⚔️ Gladiator Strategy Update
- ATR: 211.61
- IB Range: 59.7 → Small
- Market Structure: Balanced
- Trade Highlights:
1) 10:00 AM – Short Trigger → Target Hit (R:R = 1:3.64)
📌 Support & Resistance Levels
Resistance Zones:
- 24,785
- 24,835 ~ 24,845
- 24,895 ~ 24,910
- 24,975 ~ 25,004
Support Zones:
- 24,685
- 24,657
- 24,630 ~ 24,620
- 24,540 ~ 24,525
💡 Final Thoughts
Today’s Hammer at the lows signals that buyers are quietly absorbing supply. But conviction remains missing—two back-to-back sessions show indecision at higher levels. Until either 24,620 breaks or 24,830 is sustained, expect choppy action favoring intraday trades over positional setups.
📖 “Reversals don’t start with noise—they begin with defense at key levels.”
✏️ Disclaimer
This is just my personal viewpoint. Always consult your financial advisor before taking any action.
Read my blogs here:
substack.com/@kzatakia
Follow me on Telegram:
t.me/swingtraderhub
Follow me on X:
x.com/kzatakia
substack.com/@kzatakia
Follow me on Telegram:
t.me/swingtraderhub
Follow me on X:
x.com/kzatakia
Related publications
Disclaimer
The information and publications are not meant to be, and do not constitute, financial, investment, trading, or other types of advice or recommendations supplied or endorsed by TradingView. Read more in the Terms of Use.