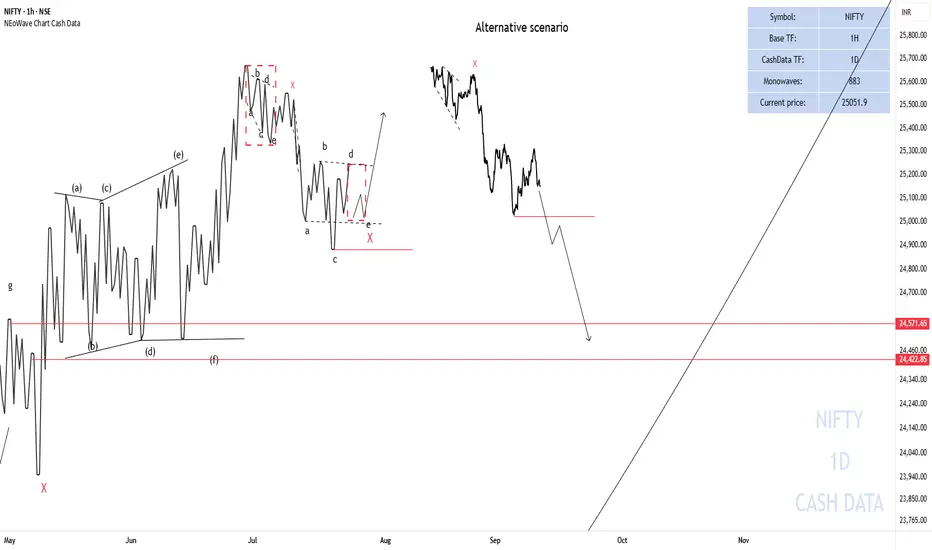
NIFTY briefly went below 25000 points but could not consolidate so a possible scenario is that X- wave is forming, triangle - X - triangle and then the upward movement starts.
Alternative scenario
If the end of wave-c of the reverse triangle breaks (red horizontal line), NIFTY could decline to the specified range.
Good luck
NEoWave Chart
Alternative scenario
If the end of wave-c of the reverse triangle breaks (red horizontal line), NIFTY could decline to the specified range.
Good luck
NEoWave Chart
Note
Wave-e of the reverse contracting triangle is the end of the c-wave (the red horizontal line) and it seems that the alternative scenario is happeningI think that maybe the second pattern is turning into a diametric one. It seems logical to me.
According to what I said earlier, the downtrend that started on June 27, 2025, no longer has the criteria of an X-wave because it is much larger in time and price than the previous X-wave that formed on May 2, 2025 to May 9, 2025, and they are not proportional to each other. As a result, the downtrend can continue to the specified range.
If the resistance at 25,255 points is broken with strength to the upside, the scenario will be violated.
Good luck
NEoWave Chart
Related publications
Disclaimer
The information and publications are not meant to be, and do not constitute, financial, investment, trading, or other types of advice or recommendations supplied or endorsed by TradingView. Read more in the Terms of Use.
Related publications
Disclaimer
The information and publications are not meant to be, and do not constitute, financial, investment, trading, or other types of advice or recommendations supplied or endorsed by TradingView. Read more in the Terms of Use.