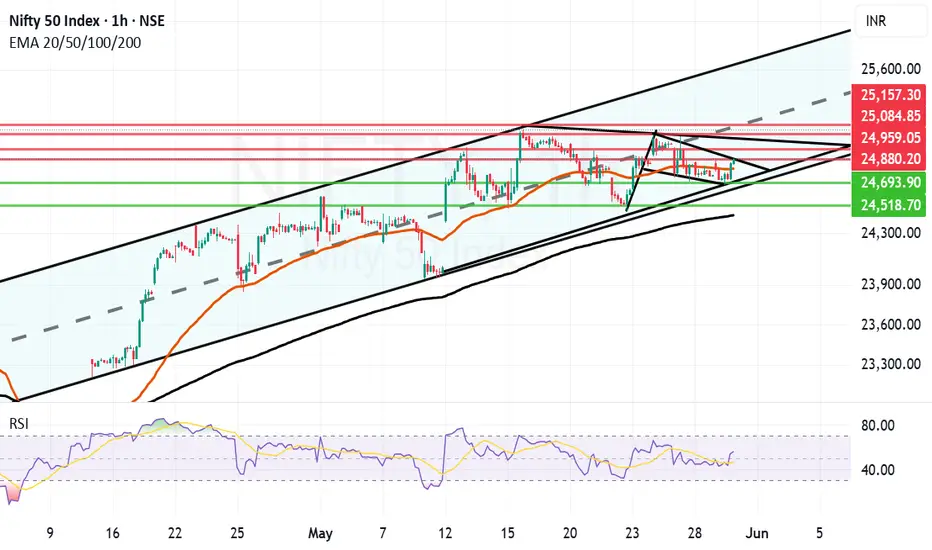
There is a very positive looking flag and pole kind of structure forming in Nifty hourly chart. This is within a parallel channel which Nifty has been following since April 15th 2025. This Flag and Pole breakout will come into effect if and only if we get a closing above 24880.
In case of flag and pole breakout happening the future resistances will be near 24959, 25084 and 25157. 25157 again will be a major resistance as it will be the mid of the channel.
The supports for Nifty in case the flag and pole breakout does not take effect are at 24804 (Mother line of hourly chart) 24693, 24518 and finally 24439.
Below 24439 bears can take over the market. Above 25157 Bulls can take over the market. Shadow of the candle is effectively neutral to positive.
Disclaimer: The above information is provided for educational purpose, analysis and paper trading only. Please don't treat this as a buy or sell recommendation for the stock or index. The Techno-Funda analysis is based on data that is more than 3 months old. Supports and Resistances are determined by historic past peaks and Valley in the chart. Many other indicators and patterns like EMA, RSI, MACD, Volumes, Fibonacci, parallel channel etc. use historic data which is 3 months or older cyclical points. There is no guarantee they will work in future as markets are highly volatile and swings in prices are also due to macro and micro factors based on actions taken by the company as well as region and global events. Equity investment is subject to risks. I or my clients or family members might have positions in the stocks that we mention in our educational posts. We will not be responsible for any Profit or loss that may occur due to any financial decision taken based on any data provided in this message. Do consult your investment advisor before taking any financial decisions. Stop losses should be an important part of any investment in equity.
Disclaimer
The information and publications are not meant to be, and do not constitute, financial, investment, trading, or other types of advice or recommendations supplied or endorsed by TradingView. Read more in the Terms of Use.
Disclaimer
The information and publications are not meant to be, and do not constitute, financial, investment, trading, or other types of advice or recommendations supplied or endorsed by TradingView. Read more in the Terms of Use.