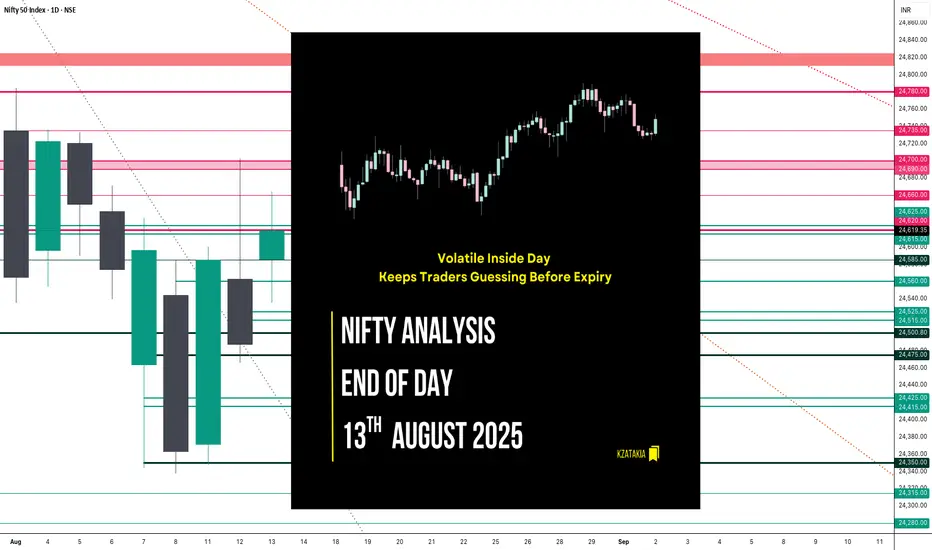
🟢 Nifty Analysis EOD – August 13, 2025 – Wednesday 🔴
Volatile Inside Day Keeps Traders Guessing Before Expiry
🗞 Nifty Summary
Nifty opened with a 102-point gap-up, driven by early bullish sentiment. However, the 24,600 zone acted as resistance right from the start, pushing prices down by 64 points to mark the day’s low at 24,535.25. Support emerged from the CPR zone, fueling a rebound that broke through 24,600 and set a new day high at 24,614.20, completing the Initial Balance (IB).
Once again, Nifty failed to sustain above 24,600, drifting between the IB range and VWAP. Around 12:40 PM, IB high was breached, but the index had to fight hard to stay above it. After an extended struggle to reach the previous day’s high, the index finally topped at 24,664.55, then retreated back toward the IB high before closing at 24,630.40.
Price action was highly volatile with no clear directional conviction, reflected in the long wicks on 5-minute candles. Structurally, the day remained balanced and inside the previous day’s range, forming an Inside Bar pattern on the daily chart — a setup known for potential breakout opportunities.
🛡 5 Min Intraday Chart with Levels

🎯 Tomorrow’s Game Plan
Tomorrow is weekly expiry, and my bias starts bullish:
💡 Bullish Plan:
If the market opens inside today’s range, I’ll wait for a breach and hold above 24,660 for long opportunities.
First hurdle: 24,700
Targets: 24,780 → 24,825 → 24,890
💡 Bearish Plan:
Not my primary view, but I’ll consider shorts if 24,525 ~ 24,515 breaks and sustains below.
First hurdle: 24,475 ~ 24,465
Targets: 24,425 → 24,350 → trail for deeper dips
📉 Daily Time Frame Chart with Intraday Levels

🕯 Daily Candle Breakdown
OHLC: Open 24,586.20 | High 24,664.55 | Low 24,535.25 | Close 24,619.35
Change: +131.95 (+0.54%)
📌 Interpretation:
Small-bodied green Spinning Top → market hesitation despite a positive close.
Close above the midpoint hints at a mild recovery attempt.
Buyers need follow-through above 24,665 to build momentum; losing 24,535 could shift bias bearish.
📊 Short-Term View
🛡 5 Min Intraday Chart

⚔ Gladiator Strategy Update
ATR: 212.98
IB Range: 78.95 → Medium
Market Structure: Balanced
Trade Highlight:
12:40 PM – Long Entry → SL Hit
📌 Support & Resistance Levels
📌 Resistance Zones:
📌 Support Zones:
💡 Final Thoughts
"Inside Bars before expiry can be like coiled springs — they can snap in either direction, and fast."
Patience in the morning and disciplined level play will be key tomorrow.
✏️ Disclaimer
This is my personal market view for educational purposes — not financial advice.
Volatile Inside Day Keeps Traders Guessing Before Expiry
🗞 Nifty Summary
Nifty opened with a 102-point gap-up, driven by early bullish sentiment. However, the 24,600 zone acted as resistance right from the start, pushing prices down by 64 points to mark the day’s low at 24,535.25. Support emerged from the CPR zone, fueling a rebound that broke through 24,600 and set a new day high at 24,614.20, completing the Initial Balance (IB).
Once again, Nifty failed to sustain above 24,600, drifting between the IB range and VWAP. Around 12:40 PM, IB high was breached, but the index had to fight hard to stay above it. After an extended struggle to reach the previous day’s high, the index finally topped at 24,664.55, then retreated back toward the IB high before closing at 24,630.40.
Price action was highly volatile with no clear directional conviction, reflected in the long wicks on 5-minute candles. Structurally, the day remained balanced and inside the previous day’s range, forming an Inside Bar pattern on the daily chart — a setup known for potential breakout opportunities.
🛡 5 Min Intraday Chart with Levels
🎯 Tomorrow’s Game Plan
Tomorrow is weekly expiry, and my bias starts bullish:
💡 Bullish Plan:
If the market opens inside today’s range, I’ll wait for a breach and hold above 24,660 for long opportunities.
First hurdle: 24,700
Targets: 24,780 → 24,825 → 24,890
💡 Bearish Plan:
Not my primary view, but I’ll consider shorts if 24,525 ~ 24,515 breaks and sustains below.
First hurdle: 24,475 ~ 24,465
Targets: 24,425 → 24,350 → trail for deeper dips
📉 Daily Time Frame Chart with Intraday Levels
🕯 Daily Candle Breakdown
OHLC: Open 24,586.20 | High 24,664.55 | Low 24,535.25 | Close 24,619.35
Change: +131.95 (+0.54%)
- Body: 33.15 points (small)
- Upper Wick: 45.20 points
- Lower Wick: 50.95 points
📌 Interpretation:
Small-bodied green Spinning Top → market hesitation despite a positive close.
Close above the midpoint hints at a mild recovery attempt.
Buyers need follow-through above 24,665 to build momentum; losing 24,535 could shift bias bearish.
📊 Short-Term View
- Bias: Mildly bullish above 24,585
- Support: 24,500 – 24,475
- Resistance: 24,660 – 24,700
🛡 5 Min Intraday Chart
⚔ Gladiator Strategy Update
ATR: 212.98
IB Range: 78.95 → Medium
Market Structure: Balanced
Trade Highlight:
12:40 PM – Long Entry → SL Hit
📌 Support & Resistance Levels
📌 Resistance Zones:
- 24,660
- 24,690 ~ 24,700
- 24,735
- 24,780
📌 Support Zones:
- 24,585
- 24,560
- 24,525 ~ 24,515
- 24,500
- 24,475
💡 Final Thoughts
"Inside Bars before expiry can be like coiled springs — they can snap in either direction, and fast."
Patience in the morning and disciplined level play will be key tomorrow.
✏️ Disclaimer
This is my personal market view for educational purposes — not financial advice.
Read my blogs here:
substack.com/@kzatakia
Follow me on Telegram:
t.me/swingtraderhub
Follow me on X:
x.com/kzatakia
substack.com/@kzatakia
Follow me on Telegram:
t.me/swingtraderhub
Follow me on X:
x.com/kzatakia
Related publications
Disclaimer
The information and publications are not meant to be, and do not constitute, financial, investment, trading, or other types of advice or recommendations supplied or endorsed by TradingView. Read more in the Terms of Use.