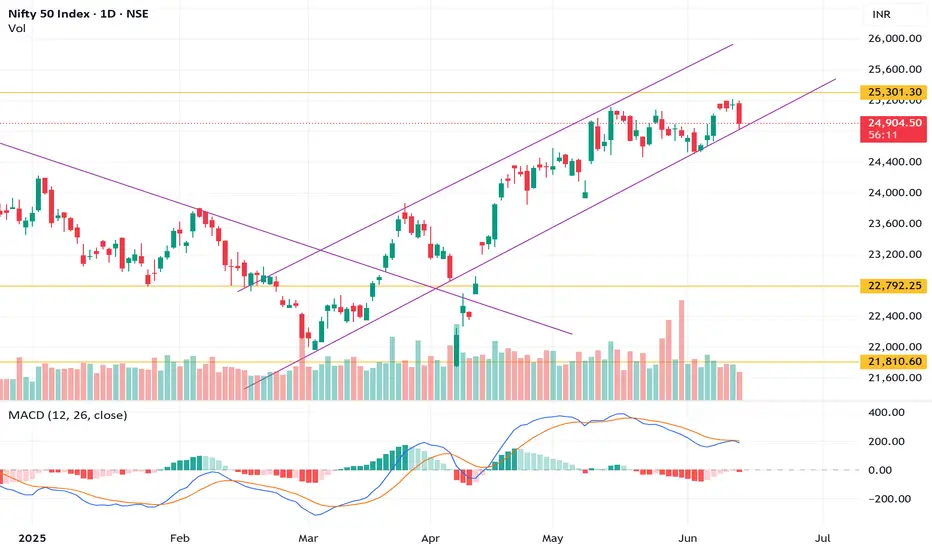
Chart Type: Daily (1D)
Index: Nifty 50 (NSE)
Current Price: ₹24,866
Date: June 12, 2025
🔍 Technical Analysis:
Rising Channel:
Nifty 50 is trading within a well-defined ascending channel. The recent price action shows a strong bounce from the lower channel trendline, but today's candle indicates rejection near the upper boundary around ₹25,300.
Resistance Zone:
The level ₹25,301 is acting as a major resistance zone. A decisive close above this could push Nifty towards ₹25,600–25,800.
Support Levels:
Immediate support rests around ₹24,600 (channel midline) and stronger support near ₹24,250–24,100 (aligned with moving averages).
Moving Averages:
Price is comfortably above both the 50 EMA and 200 EMA, indicating a bullish medium-to-long term trend.
50 EMA ≈ ₹24,253
200 EMA ≈ ₹24,083
MACD Indicator:
MACD line is above the signal line but showing signs of a potential bearish crossover. Momentum is slowing, so short-term caution is advised.
Volume:
Selling volume is picking up—watch for confirmation. If accompanied by a breakdown below ₹24,600, a short-term correction could begin.
📌 Trade Plan:
Bullish Bias:
If Nifty breaks and sustains above ₹25,301 with strong volume, expect upside towards ₹25,600–₹25,800.
Bearish Bias:
Rejection at resistance and break below ₹24,600 could lead to a fall toward ₹24,250, and even ₹23,800 in the short term.
Disclaimer
The information and publications are not meant to be, and do not constitute, financial, investment, trading, or other types of advice or recommendations supplied or endorsed by TradingView. Read more in the Terms of Use.
Disclaimer
The information and publications are not meant to be, and do not constitute, financial, investment, trading, or other types of advice or recommendations supplied or endorsed by TradingView. Read more in the Terms of Use.