🟢 Nifty Analysis EOD – June 12, 2025 – Thursday 🔴
📉 Range Breakout on Expiry – Bears Steal the Show
As highlighted in yesterday’s note — “Watch 25,222 on the upside and 25,080 on the downside for breakout” — Thursday’s expiry session decisively broke the range to the downside, unleashing a sharp bearish move.
Nifty opened strong at 25,164.45, briefly tested 25,196, but once again failed to challenge 25,200. The rejection triggered a slide to 25,083, and shortly after, the critical support of 25,080 gave way. This breakdown triggered long unwinding and fresh shorts, accelerating the fall all the way to 24,825.90 — a sharp 197-point drop.
Though there was a brief 90-point retracement, that too was sold into, and the index closed at 24,888.20 (adjusted), very close to the day’s low. This fall filled the Gaps created on June 6 and 9, and settled around the 0.5 Fibonacci retracement level (based on June 3 low to June 11 high).
With such a close, the market signals a strong shift in sentiment. Going ahead, 24800–24768 becomes a critical support zone. Bulls now need to reclaim and close above 25,020 to regain any strength. Until then, bias remains bearish.
🛡 5 Min Chart with Levels

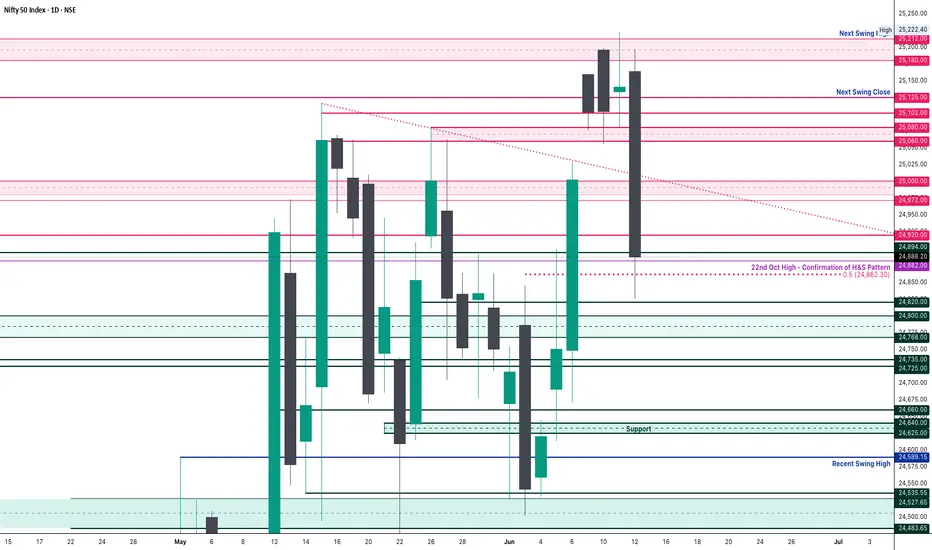
🕯 Daily Time Frame Chart

🕯 Daily Candle Breakdown
Open: 25,164.45
High: 25,196.20
Low: 24,825.90
Close: 24,888.20
Net Change: −253.20 (−1.01%)
📊 Candle Structure Breakdown
Real Body: 276.25 pts → 🔴 Strong Red Candle
Upper Wick: 31.75 pts
Lower Wick: 62.30 pts
🔍 Interpretation
Bears dominated from start to finish, with hardly any resistance from the bulls.
The close near the day’s low reinforces strong bearish sentiment.
The lower wick is minimal — buying interest was absent post-selloff.
🔦 Candle Type
🔥 Bearish Marubozu–like Candle– Reflects powerful downside momentum and strong seller conviction.
📌 Key Insight
The candle wipes out 3 sessions of buildup — textbook bearish breakdown.
Support at 24,820–24,850 is critical. A breakdown from here could invite deeper correction.
Only a close above 25,020 can negate this bearish tone. Otherwise, weakness may persist.
🛡 5 Min Intraday Chart

⚔️ Gladiator Strategy Update
ATR: 252.81
IB Range: 131.4 → Medium IB
Market Structure: Balanced
Trades:✅ 11:10 AM – Short Triggered → Target Achieved, Trailing SL Hit (RR: 1:4.65)
📌 Support & Resistance Zones
Resistance Levels
24,920
24,972 ~ 25,000
25,060 ~ 25,080
25,102
25,125
25,180 ~ 25,212
Support Levels
24,820
24,800 ~ 24,768
24,735 ~ 24,725
24,660
24,640 ~ 24,625
💭 Final Thoughts
With a decisive range breakdown and expiry volatility behind us, the battle zone shifts to 24,800–25,000. Expect more pressure if bulls fail to reclaim 25,020.
🧠 “Markets don’t wait forever at the edge of range—they break, and break hard.”
✏️ Disclaimer
This is just my personal viewpoint. Always consult your financial advisor before taking any action.
📉 Range Breakout on Expiry – Bears Steal the Show
As highlighted in yesterday’s note — “Watch 25,222 on the upside and 25,080 on the downside for breakout” — Thursday’s expiry session decisively broke the range to the downside, unleashing a sharp bearish move.
Nifty opened strong at 25,164.45, briefly tested 25,196, but once again failed to challenge 25,200. The rejection triggered a slide to 25,083, and shortly after, the critical support of 25,080 gave way. This breakdown triggered long unwinding and fresh shorts, accelerating the fall all the way to 24,825.90 — a sharp 197-point drop.
Though there was a brief 90-point retracement, that too was sold into, and the index closed at 24,888.20 (adjusted), very close to the day’s low. This fall filled the Gaps created on June 6 and 9, and settled around the 0.5 Fibonacci retracement level (based on June 3 low to June 11 high).
With such a close, the market signals a strong shift in sentiment. Going ahead, 24800–24768 becomes a critical support zone. Bulls now need to reclaim and close above 25,020 to regain any strength. Until then, bias remains bearish.
🛡 5 Min Chart with Levels
🕯 Daily Time Frame Chart
🕯 Daily Candle Breakdown
Open: 25,164.45
High: 25,196.20
Low: 24,825.90
Close: 24,888.20
Net Change: −253.20 (−1.01%)
📊 Candle Structure Breakdown
Real Body: 276.25 pts → 🔴 Strong Red Candle
Upper Wick: 31.75 pts
Lower Wick: 62.30 pts
🔍 Interpretation
Bears dominated from start to finish, with hardly any resistance from the bulls.
The close near the day’s low reinforces strong bearish sentiment.
The lower wick is minimal — buying interest was absent post-selloff.
🔦 Candle Type
🔥 Bearish Marubozu–like Candle– Reflects powerful downside momentum and strong seller conviction.
📌 Key Insight
The candle wipes out 3 sessions of buildup — textbook bearish breakdown.
Support at 24,820–24,850 is critical. A breakdown from here could invite deeper correction.
Only a close above 25,020 can negate this bearish tone. Otherwise, weakness may persist.
🛡 5 Min Intraday Chart
⚔️ Gladiator Strategy Update
ATR: 252.81
IB Range: 131.4 → Medium IB
Market Structure: Balanced
Trades:✅ 11:10 AM – Short Triggered → Target Achieved, Trailing SL Hit (RR: 1:4.65)
📌 Support & Resistance Zones
Resistance Levels
24,920
24,972 ~ 25,000
25,060 ~ 25,080
25,102
25,125
25,180 ~ 25,212
Support Levels
24,820
24,800 ~ 24,768
24,735 ~ 24,725
24,660
24,640 ~ 24,625
💭 Final Thoughts
With a decisive range breakdown and expiry volatility behind us, the battle zone shifts to 24,800–25,000. Expect more pressure if bulls fail to reclaim 25,020.
🧠 “Markets don’t wait forever at the edge of range—they break, and break hard.”
✏️ Disclaimer
This is just my personal viewpoint. Always consult your financial advisor before taking any action.
Read my blogs here:
substack.com/@kzatakia
Follow me on Telegram:
t.me/swingtraderhub
Follow me on X:
x.com/kzatakia
substack.com/@kzatakia
Follow me on Telegram:
t.me/swingtraderhub
Follow me on X:
x.com/kzatakia
Related publications
Disclaimer
The information and publications are not meant to be, and do not constitute, financial, investment, trading, or other types of advice or recommendations supplied or endorsed by TradingView. Read more in the Terms of Use.