🟢 Nifty Analysis EOD – August 28, 2025 – Thursday 🔴
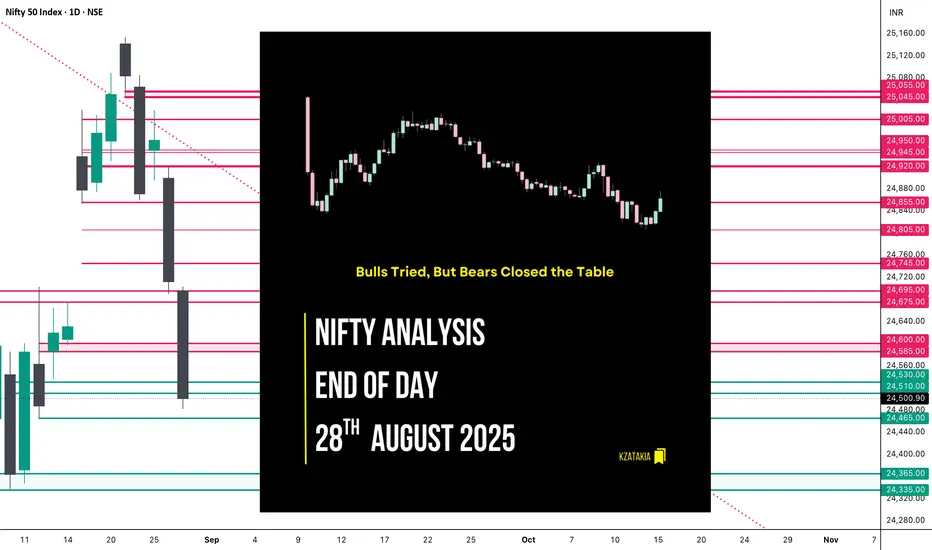
Bulls Tried, But Bears Closed the Table
🗞 Nifty Summary 🗞
Nifty started almost flat but below the prior low, and selling pressure hit from the first tick — falling 195 points in just 10 minutes to mark the day low at 24,507. Support came in, leading to a 170-point recovery, almost touching the day high near 24,675–24,695, but the support zone flipped into resistance. A sharp rejection dragged the index back to the lows, even breaching them to mark a new day low at 24,481.60.
By the close, a mild 50-point recovery couldn’t change the tone, with Nifty finishing at 24,533.10, down −211.15 points (−0.85%).
Over the last 5 sessions, Nifty has lost 672 points, slipping below the Fib 0.786 retracement of the recent swing high-low range.
🛡 5 Min Intraday Chart with Levels

📊 Intraday Walk
📉 Daily Time Frame Chart with Intraday Levels

🕯 Daily Candle Breakdown
🏗️ Structure Breakdown
📚 Interpretation
🕯Candle Type
🔎 Short-Term View
📌 The market is clearly moving in phases:
Bulls must defend 24,350 to prevent a deeper correction.
🛡 5 Min Intraday Chart

⚔️ Gladiator Strategy Update
📌 Support & Resistance Levels
Resistance Zones:
Support Zones:
🏹 Final Thoughts
“Markets don’t lie. When a support flips to resistance, the message is loud and clear — respect the structure.”
✏️ Disclaimer ✏️
This is just my personal viewpoint. Always consult your financial advisor before taking any action.
Bulls Tried, But Bears Closed the Table
🗞 Nifty Summary 🗞
Nifty started almost flat but below the prior low, and selling pressure hit from the first tick — falling 195 points in just 10 minutes to mark the day low at 24,507. Support came in, leading to a 170-point recovery, almost touching the day high near 24,675–24,695, but the support zone flipped into resistance. A sharp rejection dragged the index back to the lows, even breaching them to mark a new day low at 24,481.60.
By the close, a mild 50-point recovery couldn’t change the tone, with Nifty finishing at 24,533.10, down −211.15 points (−0.85%).
Over the last 5 sessions, Nifty has lost 672 points, slipping below the Fib 0.786 retracement of the recent swing high-low range.
🛡 5 Min Intraday Chart with Levels
📊 Intraday Walk
- Gap-down, immediate 195-point fall to 24,507.
- Bulls attempt recovery, index climbs 170 points.
- Faces rejection at 24,675–24,695, prior support turned resistance.
- Sellers regain control, Nifty revisits lows.
- Breach of earlier low, new low at 24,481.60.
- Small 50-point bounce, closes weak at 24,533.10.
📉 Daily Time Frame Chart with Intraday Levels
🕯 Daily Candle Breakdown
- Open: 24,695.80
- High: 24,702.65
- Low: 24,481.60
- Close: 24,500.90
- Change: −211.15 (−0.85%)
🏗️ Structure Breakdown
- Candle: Red (Close < Open)
- Body: 194.90 points (large bearish body)
- Upper wick: ~7 points → no strength above open
- Lower wick: ~19 points → weak recovery attempt
📚 Interpretation
- Gap-down open, below PDL.
- Buyers failed to sustain upside; day’s high just 7 points above open.
- Persistent selling throughout, only a minor bounce at close.
- Another strong bearish candle, very similar to yesterday’s.
🕯Candle Type
- Bearish Marubozu–style (big red body, tiny wicks).
- Signifies trend-confirming, decisive selling pressure.
🔎 Short-Term View
- Support: 24,480–24,450 (tested today). Break → 24,365–24,335.
- Resistance: 24,695–24,720 (gap-down + rejection zone).
📌 The market is clearly moving in phases:
- 21st → Pause and alert
- 22nd → trend reversal confirmation
- 25th → pullback rejection
- 26th → confirmation
- 28th → bearish extension
Bulls must defend 24,350 to prevent a deeper correction.
🛡 5 Min Intraday Chart
⚔️ Gladiator Strategy Update
- ATR: 204.83
- IB Range: 195.45 → Medium
- Market Structure: ImBalanced
- Trade Highlights
- 9:45 AM – Long Trigger → Target achieved (R:R 1:1.5)
- 12:55 PM – Short Trigger → Target achieved (R:R 1:1.5)
📌 Support & Resistance Levels
Resistance Zones:
- 24,585 ~ 24,600
- 24,675 ~ 24,695
- 24,745
Support Zones:
- 24,665 ~ 24,650
- 24,365 ~ 24,335
🏹 Final Thoughts
“Markets don’t lie. When a support flips to resistance, the message is loud and clear — respect the structure.”
✏️ Disclaimer ✏️
This is just my personal viewpoint. Always consult your financial advisor before taking any action.
Read my blogs here:
substack.com/@kzatakia
Follow me on Telegram:
t.me/swingtraderhub
Follow me on X:
x.com/kzatakia
substack.com/@kzatakia
Follow me on Telegram:
t.me/swingtraderhub
Follow me on X:
x.com/kzatakia
Disclaimer
The information and publications are not meant to be, and do not constitute, financial, investment, trading, or other types of advice or recommendations supplied or endorsed by TradingView. Read more in the Terms of Use.