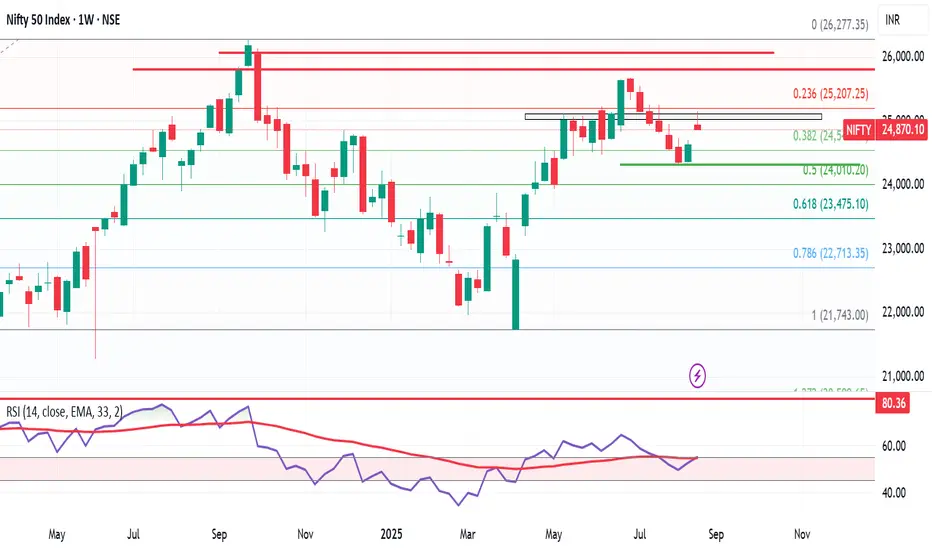
Nifty closed this week at 24,870, up 240 points from the previous week’s close. It made a high of 25,153 and a low of 24,852, once again respecting my projected range of 25,100 – 24,300.
But here’s the key: this week, Nifty formed a Shooting Star candle, which is a bearish reversal pattern. As long as Nifty stays above 24,852, bulls are safe. But a break below this level could trigger downward pressure toward 24,400.
📊 Next Week’s Range:
➡️ Likely range → 25,350 – 24,400
➡️ Break below 24,852 = bearish pressure
➡️ If 24,400 breaks, 23,900 could come into play
Historical September Pattern:
From the 2nd week of September, markets have historically shown 6–11% corrections from their highs. If history repeats, within the next 10 days we could see another push toward 25,600/25,700, followed by heavy selling pressure.
✅ My Plan:
If markets rise in the coming days, I’ll be looking to cash out from existing positions and prepare to re-enter at better levels if a correction begins in the 2nd or 3rd week of September.
US Market Update – S&P500
The S&P500 bounced from 6,343 support and managed to close just 10 points higher than last week. Above its previous week’s high of 6,481, it has the potential to test the 6,568 Fibonacci level. Investors in US markets should trail their stop-loss to 6,330 to safeguard profits.
Want me to review any index or cryptocurrency for you? Drop it in the comments and I’ll cover it in my next update!
Disclaimer
The information and publications are not meant to be, and do not constitute, financial, investment, trading, or other types of advice or recommendations supplied or endorsed by TradingView. Read more in the Terms of Use.
Disclaimer
The information and publications are not meant to be, and do not constitute, financial, investment, trading, or other types of advice or recommendations supplied or endorsed by TradingView. Read more in the Terms of Use.