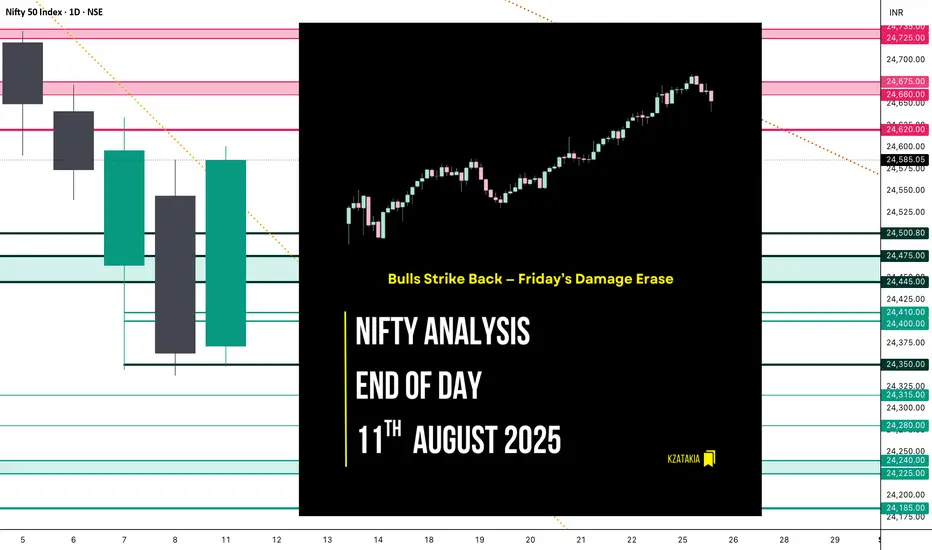
🟢 Nifty Analysis EOD – August 11, 2025 – Monday 🔴
Bulls Strike Back — Friday’s Damage Erase
📝 Nifty Summary
Nifty opened 29 points higher and quickly filled the gap. At the previous day’s close, it took support and marked the day’s low at 24,347.45 — which remained untouched for the rest of the session. From there, it fought through each resistance level, climbed to the previous day’s high, and marked a day high of 24,600.85.
A mild 40-point dip followed, but the index still closed strong at 24,560.45, reclaiming all of Friday’s losses and nearly matching Thursday’s close (just 11 points short).
The question now:
a) Was this just a dead cat bounce?
b) Or the start of a base-building phase after oversold conditions?
c) Or was it fueled by some positive news? (No major news tracked today)
Whatever the cause, bulls are back in the zone. To maintain positive momentum, tomorrow’s close needs to be above 24,650.
🛡 5 Min Intraday Chart with Levels

📉 Daily Time Frame Chart with Intraday Levels

📉 Daily Candle Breakdown
Structure Breakdown
Candle Type: Green (Close > Open)
Body Size: 213.55 points (near-full body)
Upper Wick: 15.80 points (tiny)
Lower Wick: 24.05 points (small)
Interpretation
Strong bullish control: Open near the low, close near the high.
Minimal wicks show decisive directional movement with little intraday rejection.
Fully recovered from Friday’s sell-off — almost engulfing it.
Candle Pattern: Bullish Marubozu (near-full body) — often a sign of potential upside continuation if volume supports the move.
📊 Short-Term View (from August 8, 2025 reference)
Price reclaimed the 24,460 resistance zone and closed above it.
Momentum shifted from bearish to bullish.
Next watch: 24,620-24,675 supply zone, and 24,700 psychological mark.
Range & Bias
Support Zone: 24,475 – 24,445
Resistance Zone: 24,660, 24,725
Bias: Bullish above 24,460
Trading Insight
If buyers hold above 24,460, next target is 24,725.
Rejection there may trigger a quick pullback toward 24,500.
🛡 5 Min Intraday Chart

⚔ Gladiator Strategy Update
10:20 AM: Long Entry → Target Hit (R:R = 1:2.65)
🗺 Support & Resistance Levels
Resistance Zones:
Support Zones:
💭 Final Thoughts
Strong comeback by the bulls today, erasing Friday’s weakness in one swift move. Whether it’s a one-off bounce or the start of something bigger will be clearer after tomorrow’s close.
"Structure is key. When levels hold, momentum follows — when they break, so does conviction."
✏️ Disclaimer
This is just my personal viewpoint. Always consult your financial advisor before taking any action.
Bulls Strike Back — Friday’s Damage Erase
📝 Nifty Summary
Nifty opened 29 points higher and quickly filled the gap. At the previous day’s close, it took support and marked the day’s low at 24,347.45 — which remained untouched for the rest of the session. From there, it fought through each resistance level, climbed to the previous day’s high, and marked a day high of 24,600.85.
A mild 40-point dip followed, but the index still closed strong at 24,560.45, reclaiming all of Friday’s losses and nearly matching Thursday’s close (just 11 points short).
The question now:
a) Was this just a dead cat bounce?
b) Or the start of a base-building phase after oversold conditions?
c) Or was it fueled by some positive news? (No major news tracked today)
Whatever the cause, bulls are back in the zone. To maintain positive momentum, tomorrow’s close needs to be above 24,650.
🛡 5 Min Intraday Chart with Levels
📉 Daily Time Frame Chart with Intraday Levels
📉 Daily Candle Breakdown
- Open: 24,371.50
- High: 24,600.85
- Low: 24,347.45
- Close: 24,585.05
- Change: +221.75 (+0.91%)
Structure Breakdown
Candle Type: Green (Close > Open)
Body Size: 213.55 points (near-full body)
Upper Wick: 15.80 points (tiny)
Lower Wick: 24.05 points (small)
Interpretation
Strong bullish control: Open near the low, close near the high.
Minimal wicks show decisive directional movement with little intraday rejection.
Fully recovered from Friday’s sell-off — almost engulfing it.
Candle Pattern: Bullish Marubozu (near-full body) — often a sign of potential upside continuation if volume supports the move.
📊 Short-Term View (from August 8, 2025 reference)
Price reclaimed the 24,460 resistance zone and closed above it.
Momentum shifted from bearish to bullish.
Next watch: 24,620-24,675 supply zone, and 24,700 psychological mark.
Range & Bias
Support Zone: 24,475 – 24,445
Resistance Zone: 24,660, 24,725
Bias: Bullish above 24,460
Trading Insight
If buyers hold above 24,460, next target is 24,725.
Rejection there may trigger a quick pullback toward 24,500.
🛡 5 Min Intraday Chart
⚔ Gladiator Strategy Update
- ATR: 214.75
- IB Range: 80.95 → Medium
- Market Structure: Balanced
- Trade Summary:
10:20 AM: Long Entry → Target Hit (R:R = 1:2.65)
🗺 Support & Resistance Levels
Resistance Zones:
- 24,620
- 24,660 ~ 24,675
- 24,725 ~ 24,735
- 24,780
Support Zones:
- 24,500
- 24,475 ~ 24,445
- 24,410 ~ 24,400
- 24,350
💭 Final Thoughts
Strong comeback by the bulls today, erasing Friday’s weakness in one swift move. Whether it’s a one-off bounce or the start of something bigger will be clearer after tomorrow’s close.
"Structure is key. When levels hold, momentum follows — when they break, so does conviction."
✏️ Disclaimer
This is just my personal viewpoint. Always consult your financial advisor before taking any action.
Read my blogs here:
substack.com/@kzatakia
Follow me on Telegram:
t.me/swingtraderhub
Follow me on X:
x.com/kzatakia
substack.com/@kzatakia
Follow me on Telegram:
t.me/swingtraderhub
Follow me on X:
x.com/kzatakia
Related publications
Disclaimer
The information and publications are not meant to be, and do not constitute, financial, investment, trading, or other types of advice or recommendations supplied or endorsed by TradingView. Read more in the Terms of Use.