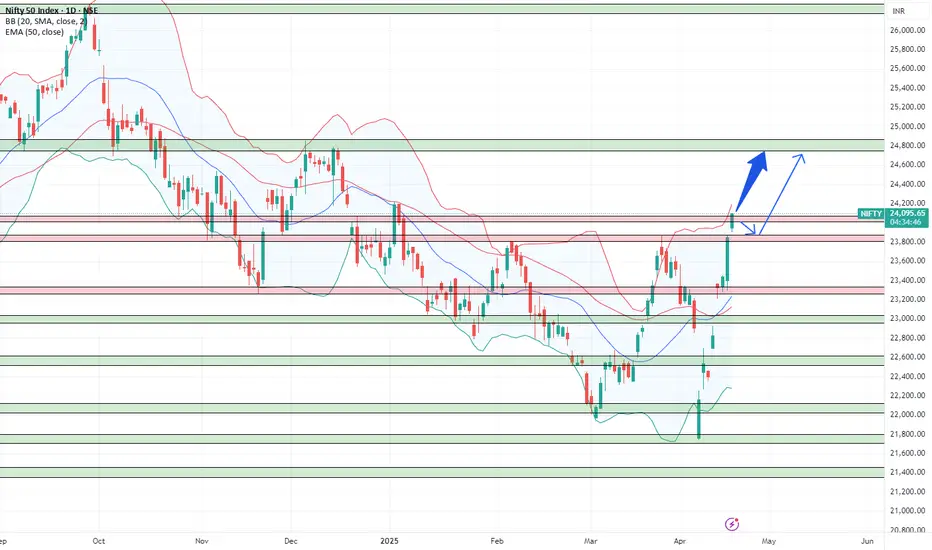
The arrow in the image points to a potential upward movement of the NIFTY index after it bounced off a support level. To provide detailed resistance and support levels specifically for this indicated movement, we need to analyze the chart around that area.
Based on the provided chart:
Support:
The most immediate support that facilitated the bounce is around the 23,800 level. This is where the price found buying interest and reversed its downward trend.
A further significant support level can be seen near 23,600. This level acted as resistance previously and now could act as support.
Resistance:
The immediate resistance that the price might encounter as it moves upwards is around the 24,200 level. This level aligns with a previous swing high and could present a hurdle for further upward movement.
A more significant resistance zone appears to be around the 24,500 - 24,600 area. This zone has acted as a strong resistance in the past, as indicated by the horizontal lines on the chart.
Therefore, for the upward movement indicated by the arrow:
Immediate Support: ₹23,800
Next Support: ₹23,600
Immediate Resistance: ₹24,200
Stronger Resistance Zone: ₹24,500 - ₹24,600
It's important to remember that these levels are based on the information visible in this specific chart and market conditions can change.
Trade active
Trigger Price AchievedNote
After Bouncing back from Immediate Support 23,800 on Friday 25/04/2025,Market Price is now Crossing the Immediate Resistance 24,200.
Trade closed: target reached
Target reached before our stronger support at 24,500Disclaimer
The information and publications are not meant to be, and do not constitute, financial, investment, trading, or other types of advice or recommendations supplied or endorsed by TradingView. Read more in the Terms of Use.
Disclaimer
The information and publications are not meant to be, and do not constitute, financial, investment, trading, or other types of advice or recommendations supplied or endorsed by TradingView. Read more in the Terms of Use.