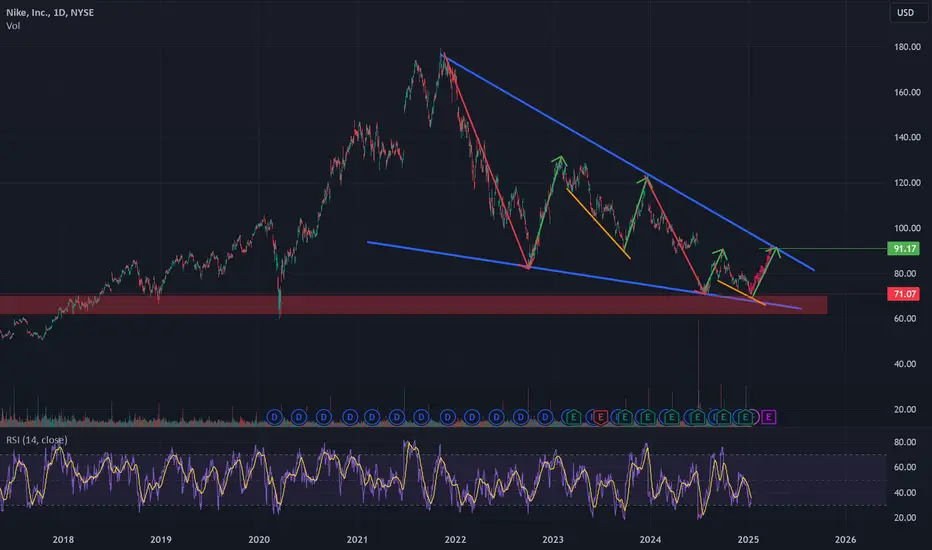
Nike has been forming a falling wedge pattern since 2021 and right now is trading at it's bottom. Prices between 70$ to 60$ are historical resistance going back to 2015, 2018 and 2020 which is being tested right now. At the same time we are at the bottom of the falling wedge.
This could be a great buying opportunity with the target of 90$. If price break down from historical resistance region, it can go as low as 50$.
This could be a great buying opportunity with the target of 90$. If price break down from historical resistance region, it can go as low as 50$.
Note
*historical resistance = historical supportTrade active
Entered at 70.6 per shareNote
I thought we might see some resistance around $75 but today we are breaking that. I believe we are still on track for $90Disclaimer
The information and publications are not meant to be, and do not constitute, financial, investment, trading, or other types of advice or recommendations supplied or endorsed by TradingView. Read more in the Terms of Use.
Disclaimer
The information and publications are not meant to be, and do not constitute, financial, investment, trading, or other types of advice or recommendations supplied or endorsed by TradingView. Read more in the Terms of Use.