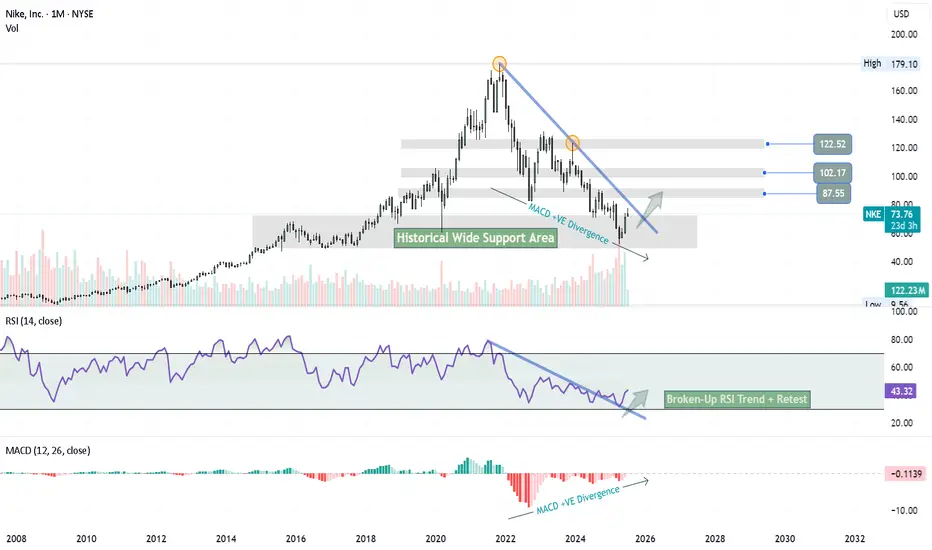
On the monthly chart, NIKE has been in a downtrend since November 2021, but the signs are pointing toward a potential trend reversal. Here's why I believe the bottom may already be in:
✅ MACD Histogram shows a strong positive divergence, signaling weakening bearish momentum.
✅ The RSI downtrend line has been broken and successfully retested, confirming bullish strength.
✅ A clear hammer candle has formed at a historical wide support zone, showing strong demand.
Now, price is facing three consecutive resistance levels — and with each breakout, the next zone becomes the new target, (87.5 → 102 → 122).
The structure suggests a step-by-step move higher if momentum holds. Keep an eye on the breakout above the descending trendline — that’s where things could accelerate.
Disclaimer
The information and publications are not meant to be, and do not constitute, financial, investment, trading, or other types of advice or recommendations supplied or endorsed by TradingView. Read more in the Terms of Use.
Disclaimer
The information and publications are not meant to be, and do not constitute, financial, investment, trading, or other types of advice or recommendations supplied or endorsed by TradingView. Read more in the Terms of Use.