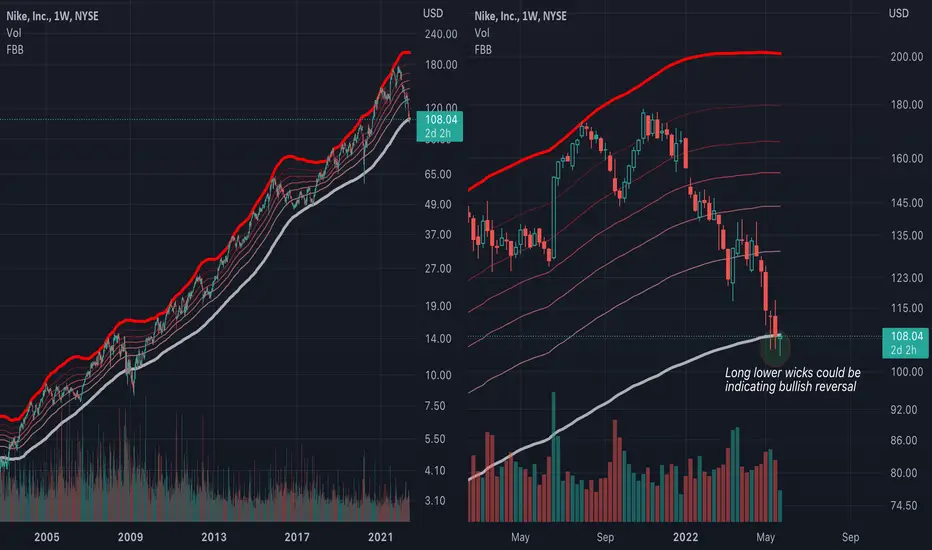
Just an observation: Nike (NKE) is currently sitting on the Fibonacci Bollinger Band (FBB) plot line that has generally acted as support for the past 20 years. The weekly candles are printing long lower wicks which could suggest a bullish reversal is building along this line. The yearly chart is not overextended and fitting perfectly on multiple linear log trend lines that stretch back decades. Seems like a warning to those who are selling or shorting Nike at this level. Anyone feel differently?
Not financial advice.
Not financial advice.
To support my work:
patreon.com/SpyMasterTrades
To subscribe to my YouTube channel:
youtube.com/@SpyMasterTrades
To follow me on X:
twitter.com/SpyMasterTrades
To tip me (BTC wallet):
bc1qvh48429042mdwvdthwlufx072g3ftffcts2q03
patreon.com/SpyMasterTrades
To subscribe to my YouTube channel:
youtube.com/@SpyMasterTrades
To follow me on X:
twitter.com/SpyMasterTrades
To tip me (BTC wallet):
bc1qvh48429042mdwvdthwlufx072g3ftffcts2q03
Disclaimer
The information and publications are not meant to be, and do not constitute, financial, investment, trading, or other types of advice or recommendations supplied or endorsed by TradingView. Read more in the Terms of Use.