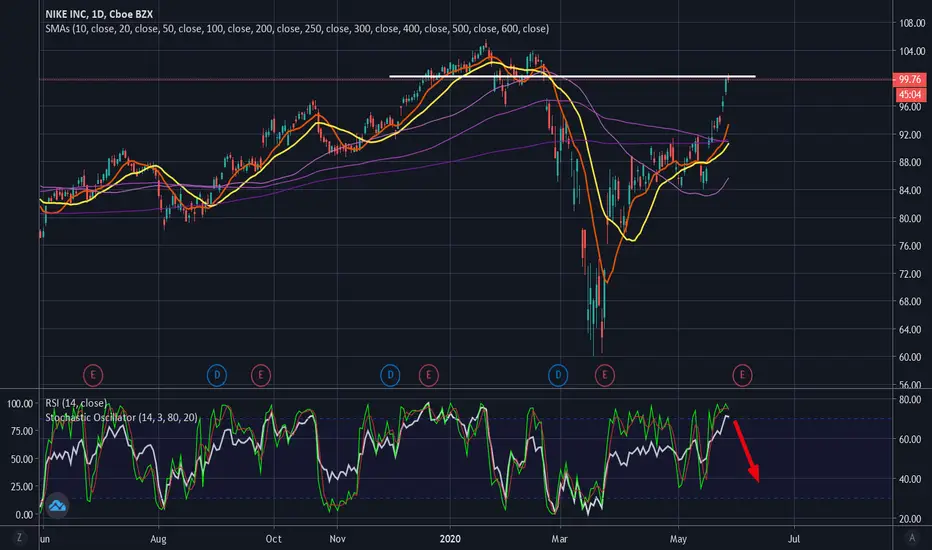
Stock is at resistance. Except for an overnight gap to all time highs, the stops would be over 100.25 (close before "V") and over 100.69 (5/28 high). Even if stock moves up to 103-105, it should turn down back to 94-96 range.
Check RSI and price on 30 or 60 min chart.
Check RSI and price on 30 or 60 min chart.
Disclaimer
The information and publications are not meant to be, and do not constitute, financial, investment, trading, or other types of advice or recommendations supplied or endorsed by TradingView. Read more in the Terms of Use.
Disclaimer
The information and publications are not meant to be, and do not constitute, financial, investment, trading, or other types of advice or recommendations supplied or endorsed by TradingView. Read more in the Terms of Use.