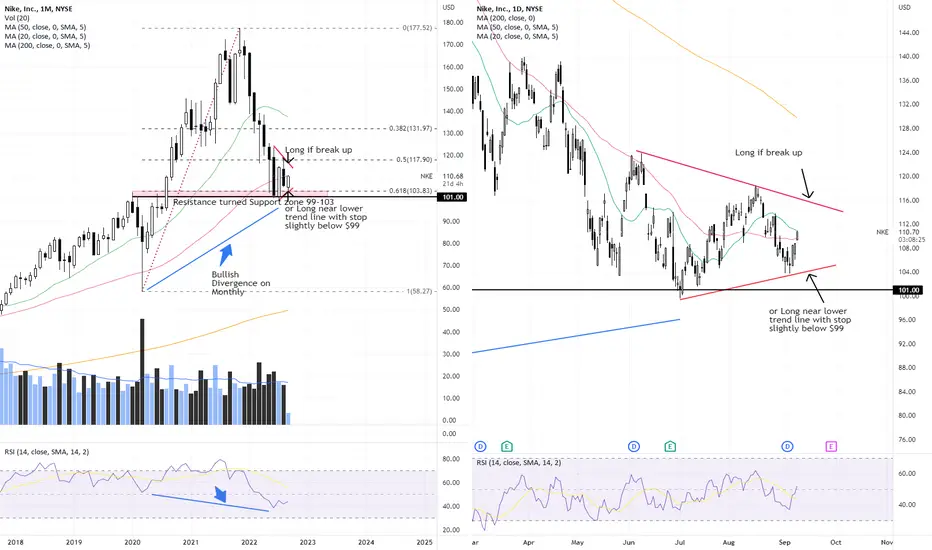
NKE tested bounced off a longer term horizontal support zone ($99 - $103) several times in the last 3 months and is now trading within a symmetrical wedge pattern. This could be both a continuation or reversal pattern depending on which side it broke out eventually.
However, I suspect the eventual break will be more likely to the upside as the resistence turned support zone ($99-$103) has been holding up in the past few months, plus a bullish divergence can be seen in the monthly chart.
Earnings expected on 29 Sep AMC. Guess we'll know by then where it is heading!
Disclaimer: Just my 2 cents and not a trade advice. Kindly do your own due diligence and trade according to your own risk tolerance and don't forget that money management is important! Take care and Good Luck!
Note
NKE should be on surer footing now that it has started to break up above the trendline resistence and rising above the 200 day Moving Average as well. I will place the initial stop loss slightly below the pennant break level (~$103). Watch out for Earnings expected on 20 December.
Disclaimer
The information and publications are not meant to be, and do not constitute, financial, investment, trading, or other types of advice or recommendations supplied or endorsed by TradingView. Read more in the Terms of Use.
Disclaimer
The information and publications are not meant to be, and do not constitute, financial, investment, trading, or other types of advice or recommendations supplied or endorsed by TradingView. Read more in the Terms of Use.