Volatile and we all know this one can be sliding right along, then a shred of bad news hits and it is back at the bottom...
Short interest is very high at 33% plus epending on where you look, but sometimes shorties accidently push price up then they have to cover their short so increases buying, hence the price..
OBV is perking up and NV is flat indication smart money bout this at bottom of 10.35..as soon as rally up began the negative volume (NV) started going flat. That does not mean they will not buy again on pull backs...so they are probably not buying today (o: Negative volume represents volume on down days where positive volume represents volume of up days, which is usually the general public..
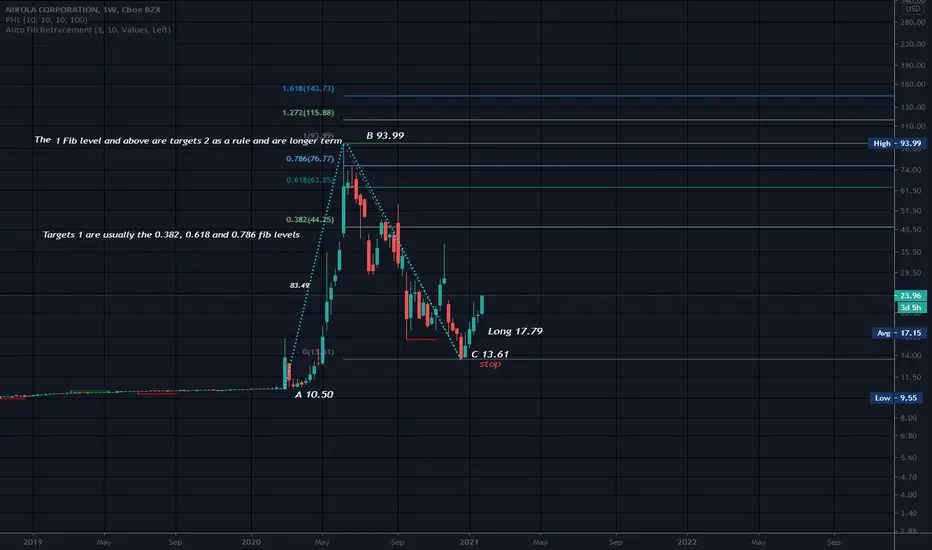
ABC patterns are a measured move down and considered a corrective pattern. D is the target and it is best to get out at D as the whole cycle starts over again which would begin with an impulse down. The longest wave in a harmonic pattern is called the Impulse wave. That is where you start your pattern at. It is obvious where the impulse wave is for NKLA.
C can not be below A in this pattern. Targets are calculated off the length of the AB leg using fib levels. 0.382, 0.618 and 0.786 are usually targets 1. Anything above that are icing on the cake and are usually target 2. The stop goes below C, or if the stock has moved away from C quite a bit, the last pivot low can be used as a stop..You can either put a fib level indicator on your chart or Multiply the length of the AB leg by these fib levels to get your targets. Long entry is when price breaks the BC leg in an uptrend and this can be subjective..ABC is a harmonic pattern as it repeats itself over and over in the market. There is also a bearish version.
When a stock falls as low as this one did, there will plenty of folks stuck overhead who are at their own individual Maximum level of financial pain, so they will sell every chance they can to get a better exit price. Imagain you bought this around the top and how you would feel. Most have probably been stopped out or sold to relieve the pain, but there are most likey still folks hanging out up there that will sell every chance they get..
Long term investors would prefer a stock that has less volatility and one that possesses a long term uptrend, although these have small corrective patterns as well. To find the long term trend, look at the monthly, at least 20 years, and I look at the 3 year weekly as well for a more recent snap shot of how the security moves in the long run. You can also find support and resistance you do not see on smaller time frames like daily, hourly, etc.. I like long term uptrends as well as I do not have to worry so much when a pull back occurs. A 20 year uptrend is likely to continue, but nothing is a given..
Buy red/sell green..
Not a recommendation..
Short interest is very high at 33% plus epending on where you look, but sometimes shorties accidently push price up then they have to cover their short so increases buying, hence the price..
OBV is perking up and NV is flat indication smart money bout this at bottom of 10.35..as soon as rally up began the negative volume (NV) started going flat. That does not mean they will not buy again on pull backs...so they are probably not buying today (o: Negative volume represents volume on down days where positive volume represents volume of up days, which is usually the general public..
ABC patterns are a measured move down and considered a corrective pattern. D is the target and it is best to get out at D as the whole cycle starts over again which would begin with an impulse down. The longest wave in a harmonic pattern is called the Impulse wave. That is where you start your pattern at. It is obvious where the impulse wave is for NKLA.
C can not be below A in this pattern. Targets are calculated off the length of the AB leg using fib levels. 0.382, 0.618 and 0.786 are usually targets 1. Anything above that are icing on the cake and are usually target 2. The stop goes below C, or if the stock has moved away from C quite a bit, the last pivot low can be used as a stop..You can either put a fib level indicator on your chart or Multiply the length of the AB leg by these fib levels to get your targets. Long entry is when price breaks the BC leg in an uptrend and this can be subjective..ABC is a harmonic pattern as it repeats itself over and over in the market. There is also a bearish version.
When a stock falls as low as this one did, there will plenty of folks stuck overhead who are at their own individual Maximum level of financial pain, so they will sell every chance they can to get a better exit price. Imagain you bought this around the top and how you would feel. Most have probably been stopped out or sold to relieve the pain, but there are most likey still folks hanging out up there that will sell every chance they get..
Long term investors would prefer a stock that has less volatility and one that possesses a long term uptrend, although these have small corrective patterns as well. To find the long term trend, look at the monthly, at least 20 years, and I look at the 3 year weekly as well for a more recent snap shot of how the security moves in the long run. You can also find support and resistance you do not see on smaller time frames like daily, hourly, etc.. I like long term uptrends as well as I do not have to worry so much when a pull back occurs. A 20 year uptrend is likely to continue, but nothing is a given..
Buy red/sell green..
Not a recommendation..
Note
Take a look at the impulse wave on NKLA...the first leg upIt is human nature to sell/greed/when you have enough profit no matter how GR8 the stock is..then you find yourself up there with a ton of sellers )o:
Securities that have been parabolic in the recent past can be very volatile to trade for quite a while afterward. Often a parabolic stock pulls back at least 50 to 62%/this one pulled back further than that and FIB levels are a good tool. Best thing to do is find an entry close to strong support so you can weather the storm (o: When you see an impulse move that is basically straight up without pullbacks to speak of..beware! Day Traders may not have this concern, but I swing trade..we are all different (o:
Disclaimer
The information and publications are not meant to be, and do not constitute, financial, investment, trading, or other types of advice or recommendations supplied or endorsed by TradingView. Read more in the Terms of Use.
Disclaimer
The information and publications are not meant to be, and do not constitute, financial, investment, trading, or other types of advice or recommendations supplied or endorsed by TradingView. Read more in the Terms of Use.