NKN/BTC
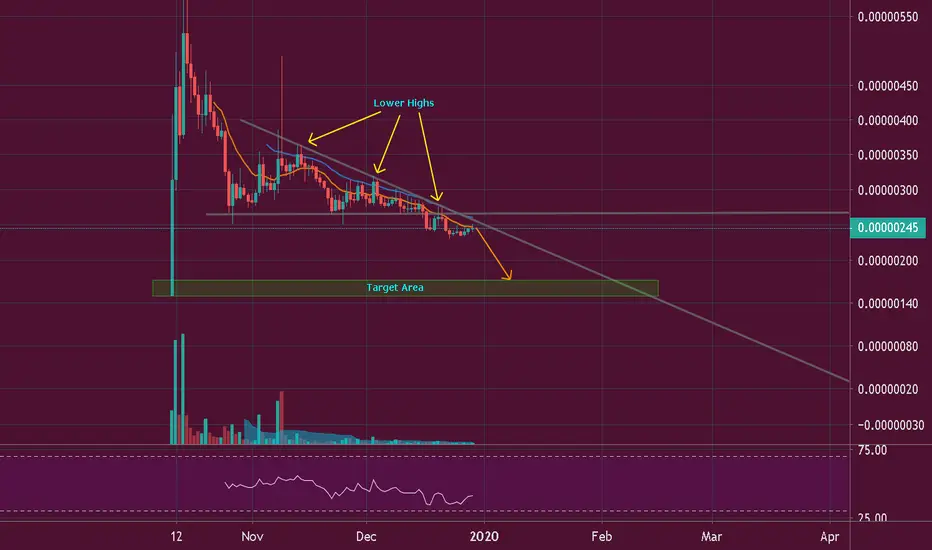
NKN broke bearish with this descending triangle pattern after the price closes below 264 sats area. NKN tried to get back above the support area
but the Daily EMAs acted as dynamic resistance and the price fell further. This bearish pattern target to the downside is between 170 - 160 sats area.
It is not wise to trade Long positions as the downtrend is just starting. Wait for confirmation before entering a trade.
Disclaimer
The information and publications are not meant to be, and do not constitute, financial, investment, trading, or other types of advice or recommendations supplied or endorsed by TradingView. Read more in the Terms of Use.
Disclaimer
The information and publications are not meant to be, and do not constitute, financial, investment, trading, or other types of advice or recommendations supplied or endorsed by TradingView. Read more in the Terms of Use.