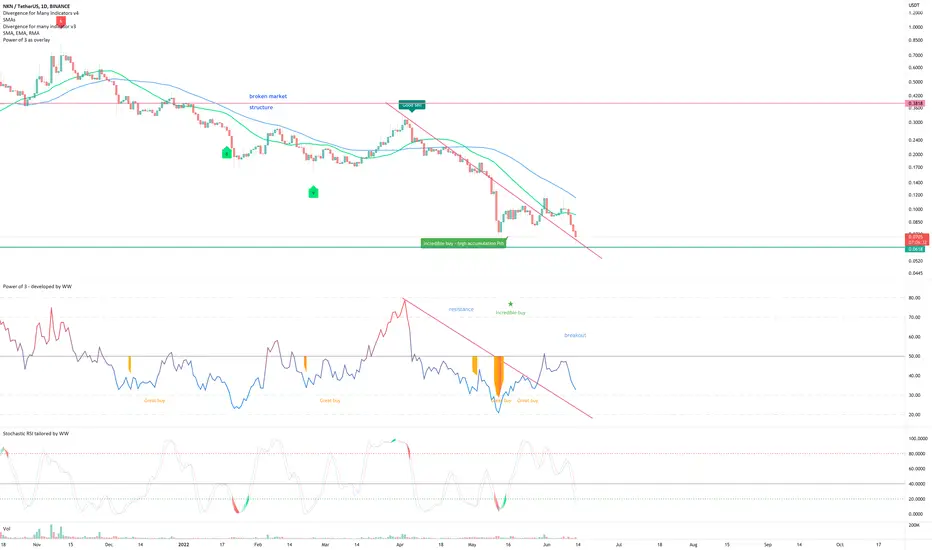
On the above 1-day chart price action has corrected 95% since April 2021. A number of reasons now exist to be long, including:
1) The ‘incredible buy’ signal.
2) Broken price action and RSI resistance.
3) Price action is testing past resistance (green line), look at the weekly chart below.
4) Price action has corrected to the golden ratio (see weekly chart below).
5) Nudge nudge wink wink. Don’t know what I mean? Shame.
Is it possible price action falls further? Sure.
Is it probable? no.
Ww
Type: trade
Risk: <=6% of portfolio
Timeframe: don’t know.
Return: $8 or 100x
Weekly chart

3-day BTC pair

1) The ‘incredible buy’ signal.
2) Broken price action and RSI resistance.
3) Price action is testing past resistance (green line), look at the weekly chart below.
4) Price action has corrected to the golden ratio (see weekly chart below).
5) Nudge nudge wink wink. Don’t know what I mean? Shame.
Is it possible price action falls further? Sure.
Is it probable? no.
Ww
Type: trade
Risk: <=6% of portfolio
Timeframe: don’t know.
Return: $8 or 100x
Weekly chart
3-day BTC pair
Note
Do you see the Bullish divergencies building on the daily chart? 11 oscillators printing divergence in the past couple of day over a 30 day period.Trade active
Don't worry about trying to time the bottom, not with a 100x opportunity.Note
The 3-day appears to have confirmed the support off past resistance.Trade active
Wedge breakout + the 'pi-cycle' bottom indicator illuminated.Note
A big move is coming..Note
The BTC 3-day pair (someone asked below) Trade active
We're styling... get this idea over 100 likes and I'll commit to identifying the top.Note
BTC pair for NKN confirms Bull Flag breakout. You think 50% today was a lot? A measured move from Wave 1 'bull flag' break out takes price action to just under 4000% for Wave 3.
Trade active
Another 12hr resistance breakout. 1) Price action breaks out of past resistance.
2) Corrects and stops on past resistance as support.
3) Support is also the golden ratio.
Isn't that fantastic? We can now forecast a 50% move in a relatively short space of time. However this idea has far far more upside on the larger time frames.
PS: Not trading this. If you want me to post updates with swing trade opportunities, ask below.
Note
15hr above not 12hrNote
Price action corrects to the golden ratio that is also past resistance, look left.Note
Probably a good moment as price action breaks out of resistance Trade active
Note
Was about to add the 4hr chart with the IB buy signal before it blew up. There's a number of other alt-tokens printing the same signal at this time on recently published ideas.To users of the indicator, scan through the 4hr charts, you'll find those IB buy signals quite quickly.
Note
Some education This was NKN before it blew up - was there a tell tell sign? Yes.
Can you see the dash purple line? The 100-week SMA
Rules:
1) A candle has already close as support. It can be a DOJI or an indecision candle.
2) A ‘Great buy’ or ‘incredible buy’ signal preceded.
This is POND before a 30% move.
Go through the ideas I’ve published, look at the BTC pairs.
Here’s a freebie - Alchemy Pay (ACH)
Have gone through a number of others, you’ll have to look. Simply put, a very few number of alt tokens are doing this right now.
Ww
Note
Another BTC pair printing on the 100-day (actually 2-day/50-day SMA).If you can't find a public MA on tradingview to print the 2-day/50-day SMA then message me and I'll share the one you see in my charts above.
Note
Another example - Injector INJ . Just like NKNTrade active
close shortsTrade active
Note
87 and onwardsTrade active
See the back-test of price action on the bull flag?? See the life cross? (smaller blue circles). All good.5-day chart
Trade active
Note
Its time.Note
Up 50% since "Its time" update... quick quick, is it time to FOMO before it flys past $1 and beyond?Can you spot the other "Its time" tokens ??
Trade active
On supportNote
Target adjusted to $5BTC
bc1q2eckdzh0q8vsd7swcc8et6ze7s99khhxyl7zwy
Weblink: patreon.com/withoutworries
Allow 3-6 months on ideas. Not investment advice. DYOR
bc1q2eckdzh0q8vsd7swcc8et6ze7s99khhxyl7zwy
Weblink: patreon.com/withoutworries
Allow 3-6 months on ideas. Not investment advice. DYOR
Related publications
Disclaimer
The information and publications are not meant to be, and do not constitute, financial, investment, trading, or other types of advice or recommendations supplied or endorsed by TradingView. Read more in the Terms of Use.
BTC
bc1q2eckdzh0q8vsd7swcc8et6ze7s99khhxyl7zwy
Weblink: patreon.com/withoutworries
Allow 3-6 months on ideas. Not investment advice. DYOR
bc1q2eckdzh0q8vsd7swcc8et6ze7s99khhxyl7zwy
Weblink: patreon.com/withoutworries
Allow 3-6 months on ideas. Not investment advice. DYOR
Related publications
Disclaimer
The information and publications are not meant to be, and do not constitute, financial, investment, trading, or other types of advice or recommendations supplied or endorsed by TradingView. Read more in the Terms of Use.