** The months ahead **
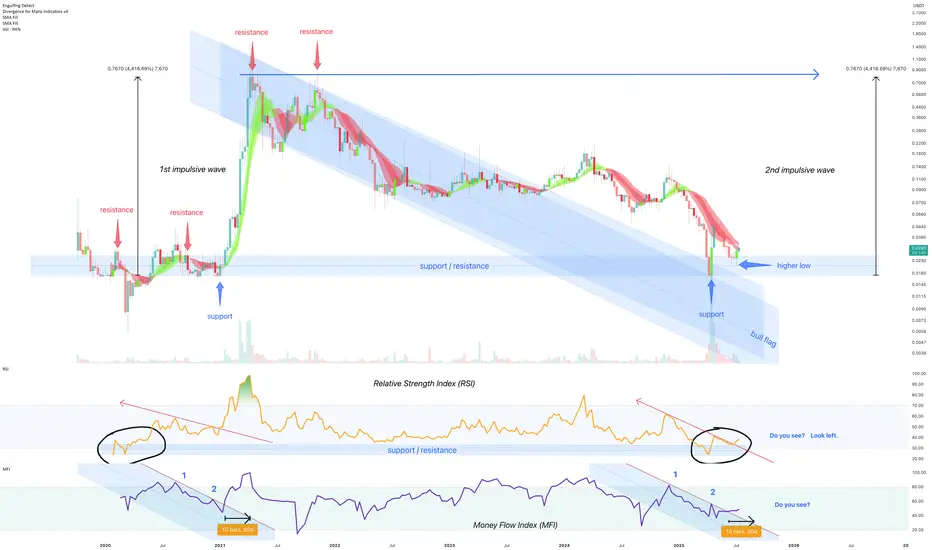
On the above 8 day chart price action has corrected 99% since 2021. The chart now displays a compelling technical setup that suggests a strong bullish continuation could be on the horizon.
Bullish Arguments:
Price action forms a clear bull flag pattern
Strong support confirmation on past resistance
Relative Strength Index (RSI) confirms resistance breakout
Money Flow Index (MFI) resistance breakout
Considering the clear bull flag formation, the strong bounce off a critical support/resistance zone, and the confirming signals from RSI and MFI indexes (or indices?!) NKN appears poised for a significant upward continuation.
Is it possible price action continues to print lower lows? Sure.
Is it probable? No.
Ww
On the above 8 day chart price action has corrected 99% since 2021. The chart now displays a compelling technical setup that suggests a strong bullish continuation could be on the horizon.
Bullish Arguments:
Price action forms a clear bull flag pattern
A classic continuation pattern typically appears after a strong upward movement (the "flag pole" or impulsive wave) and is followed by a period of downward consolidation (the "flag"). Albeit the formation rarely prints over such a long period of time for a crypto. The downtrend resistance is now broken with a support confirmation suggesting price action is preparing for another leg up, resuming its prior bullish momentum from 2020.
Strong support confirmation on past resistance
Look left. Historical price zone has proven its significance in the past, acting as both a ceiling and a floor for price movements. The current bounce off past resistance, marked by a higher low, indicates buyers are stepping in at this area. The volume entering the market, collecting emotional seller capitulations, is notable.
Relative Strength Index (RSI) confirms resistance breakout
The Relative Strength Index (RSI) reinforces the bullish outlook. Notice prior to the resistance breakout the index would now print a higher low from the same support area as in 2020.
Money Flow Index (MFI) resistance breakout
The Money Flow Index (MFI) in the lower panel provides excellent confirmation of the bullish sentiment, follow the money! The new money shows a clear pattern of resistance breakout, mirroring previous instances (marked as 1 and 2) where similar money flow preceded to see strong upward moves in price action. This indicates that money is flowing back into the token, for whatever reason I do not know.
Considering the clear bull flag formation, the strong bounce off a critical support/resistance zone, and the confirming signals from RSI and MFI indexes (or indices?!) NKN appears poised for a significant upward continuation.
Is it possible price action continues to print lower lows? Sure.
Is it probable? No.
Ww
Trade active
Now we wait... wait until until recently liquidated retail traders return with fresh exit liquidity on next month's pay day.BTC
bc1q2eckdzh0q8vsd7swcc8et6ze7s99khhxyl7zwy
Weblink: patreon.com/withoutworries
Allow 3-6 months on ideas. Not investment advice. DYOR
bc1q2eckdzh0q8vsd7swcc8et6ze7s99khhxyl7zwy
Weblink: patreon.com/withoutworries
Allow 3-6 months on ideas. Not investment advice. DYOR
Disclaimer
The information and publications are not meant to be, and do not constitute, financial, investment, trading, or other types of advice or recommendations supplied or endorsed by TradingView. Read more in the Terms of Use.
BTC
bc1q2eckdzh0q8vsd7swcc8et6ze7s99khhxyl7zwy
Weblink: patreon.com/withoutworries
Allow 3-6 months on ideas. Not investment advice. DYOR
bc1q2eckdzh0q8vsd7swcc8et6ze7s99khhxyl7zwy
Weblink: patreon.com/withoutworries
Allow 3-6 months on ideas. Not investment advice. DYOR
Disclaimer
The information and publications are not meant to be, and do not constitute, financial, investment, trading, or other types of advice or recommendations supplied or endorsed by TradingView. Read more in the Terms of Use.