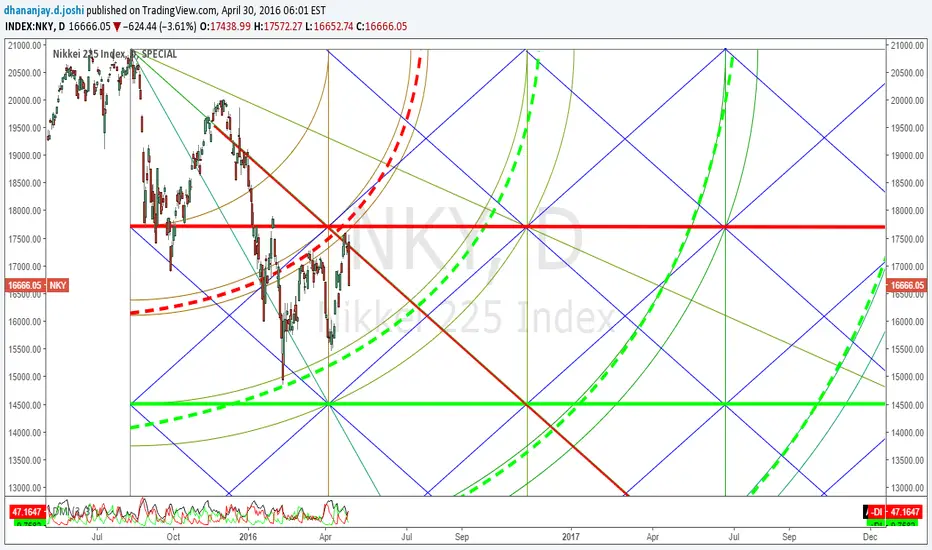
1. Green Lines\Arch - support areas where price can take support
2. Red Lines\Arch - resistance areas where price can get resisted
3. Blue lines - Lines where price can take support/resistance
One can use this chart as trading map for next few months.
Related publications
Disclaimer
The information and publications are not meant to be, and do not constitute, financial, investment, trading, or other types of advice or recommendations supplied or endorsed by TradingView. Read more in the Terms of Use.
Related publications
Disclaimer
The information and publications are not meant to be, and do not constitute, financial, investment, trading, or other types of advice or recommendations supplied or endorsed by TradingView. Read more in the Terms of Use.