🚀 Trade Idea: NMM (Navios Maritime Partners LP) - Bullish Shipping Play with Strong Upside
📈 Trading Setup
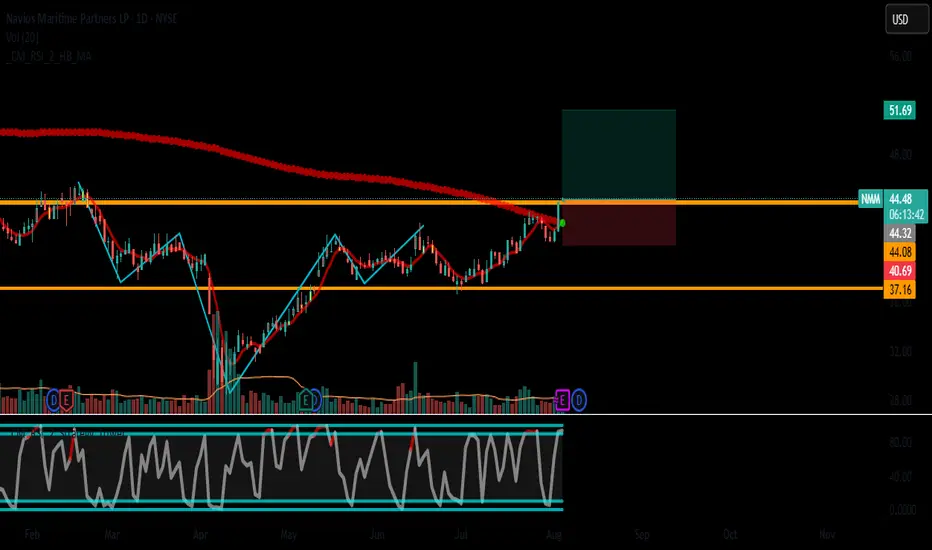
Entry: $44.35 (Breakout above consolidation)
Stop Loss: $40.70 (8.2% risk)
Take Profit: $51.70 (+16.5% upside)
Risk/Reward Ratio: 1:2
🔍 Why NMM Now?
✅ Fundamental Catalysts
Shipping Rates Recovery: Baltic Dry Index up 22% MTD
Dividend Yield: 3.8% (Paid quarterly)
Valuation:
P/E 4.2 vs industry avg 8.6
P/B 0.67 (Deep value territory)
Fleet Utilization: 98% (Industry-leading efficiency)
📊 Technical Triggers
Pattern:
Ascending triangle breakout (Daily chart)
Bull flag forming on 4H timeframe
Key Levels:
Resistance Break: $44.35 (YTD high)
Next Resistance: $51.70 (2022 swing high)
Momentum:
RSI: 62 (Healthy momentum)
MACD: Bullish histogram expansion
🎯 Trade Execution Plan
Entry Confirmation:
Wait for >3% volume spike on $44.35 break
Ideal entry on pullback to $43.80
Position Management:
50% position at breakout
50% on retest of $44 as support
Profit Strategy:
TP1: $48.00 (Partial profit)
TP2: $51.70 (Full position)
Stop Adjustment:
Trail to $42.50 after $46 break
⚠️ Risk Considerations
Commodity Sensitivity: Iron ore/coal demand fluctuations
Fuel Costs: Bunker price volatility
Dividend Safety: Payout ratio at 85% (Monitor cash flow)
📌 Sector Context
Dry Bulk Outlook:
China stimulus boosting industrial demand
Fleet growth at 20-year lows (Bullish supply/demand)
Peer Performance:
SALT +18% MTD
GOGL +12% MTD
Best For:
Swing traders (2-8 week hold)
Dividend investors seeking cyclical exposure
#NMM #Shipping #Breakout #ValueInvesting
*Chart Note: The 50-day MA ($41.20) aligns with stop level - adds confluence to risk management. Always verify live market conditions before trading.*
Pro Tip: Track Capesize rates (5TC index) for fundamental confirmation. Current rates at $18,750/day (Above break-even for most operators).
📈 Trading Setup
Entry: $44.35 (Breakout above consolidation)
Stop Loss: $40.70 (8.2% risk)
Take Profit: $51.70 (+16.5% upside)
Risk/Reward Ratio: 1:2
🔍 Why NMM Now?
✅ Fundamental Catalysts
Shipping Rates Recovery: Baltic Dry Index up 22% MTD
Dividend Yield: 3.8% (Paid quarterly)
Valuation:
P/E 4.2 vs industry avg 8.6
P/B 0.67 (Deep value territory)
Fleet Utilization: 98% (Industry-leading efficiency)
📊 Technical Triggers
Pattern:
Ascending triangle breakout (Daily chart)
Bull flag forming on 4H timeframe
Key Levels:
Resistance Break: $44.35 (YTD high)
Next Resistance: $51.70 (2022 swing high)
Momentum:
RSI: 62 (Healthy momentum)
MACD: Bullish histogram expansion
🎯 Trade Execution Plan
Entry Confirmation:
Wait for >3% volume spike on $44.35 break
Ideal entry on pullback to $43.80
Position Management:
50% position at breakout
50% on retest of $44 as support
Profit Strategy:
TP1: $48.00 (Partial profit)
TP2: $51.70 (Full position)
Stop Adjustment:
Trail to $42.50 after $46 break
⚠️ Risk Considerations
Commodity Sensitivity: Iron ore/coal demand fluctuations
Fuel Costs: Bunker price volatility
Dividend Safety: Payout ratio at 85% (Monitor cash flow)
📌 Sector Context
Dry Bulk Outlook:
China stimulus boosting industrial demand
Fleet growth at 20-year lows (Bullish supply/demand)
Peer Performance:
SALT +18% MTD
GOGL +12% MTD
Best For:
Swing traders (2-8 week hold)
Dividend investors seeking cyclical exposure
#NMM #Shipping #Breakout #ValueInvesting
*Chart Note: The 50-day MA ($41.20) aligns with stop level - adds confluence to risk management. Always verify live market conditions before trading.*
Pro Tip: Track Capesize rates (5TC index) for fundamental confirmation. Current rates at $18,750/day (Above break-even for most operators).
Disclaimer
The information and publications are not meant to be, and do not constitute, financial, investment, trading, or other types of advice or recommendations supplied or endorsed by TradingView. Read more in the Terms of Use.
Disclaimer
The information and publications are not meant to be, and do not constitute, financial, investment, trading, or other types of advice or recommendations supplied or endorsed by TradingView. Read more in the Terms of Use.