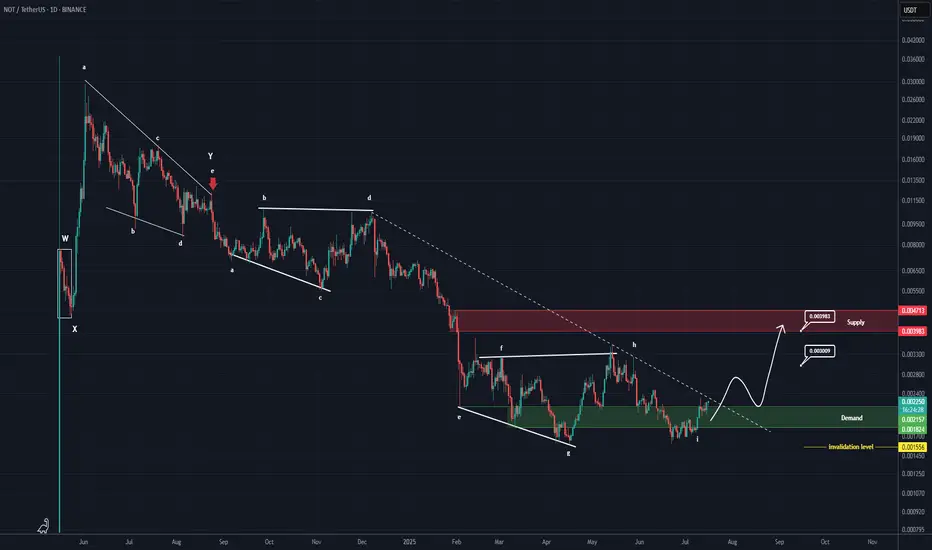
From the point where the red arrow is placed on the chart, the correction labeled as NOT has started.
The correction appears to be a symmetrical one, which now seems to be coming to an end. The current upward wave could be the X wave.
In previous analyses, we had also considered the structure to be symmetrical, but on a larger degree. However, based on the data currently available, it seems that the degree of this symmetrical structure is smaller.
If the price holds above the green zone, it may move toward the targets and the red box. The targets are marked on the chart.
A daily candle closing below the invalidation level will invalidate this analysis.
For risk management, please don't forget stop loss and capital management
When we reach the first target, save some profit and then change the stop to entry
Comment if you have any questions
Thank You
🔆To succeed in trading, just enter our Telegram channel:
Free membership: t.me/Behdark_EN
🔷Our Telegram channel has daily spot and futures signals 👉 t.me/Behdark_EN
💎 Exclusive signals are only shared on our Telegram channel
Free membership: t.me/Behdark_EN
🔷Our Telegram channel has daily spot and futures signals 👉 t.me/Behdark_EN
💎 Exclusive signals are only shared on our Telegram channel
Disclaimer
The information and publications are not meant to be, and do not constitute, financial, investment, trading, or other types of advice or recommendations supplied or endorsed by TradingView. Read more in the Terms of Use.