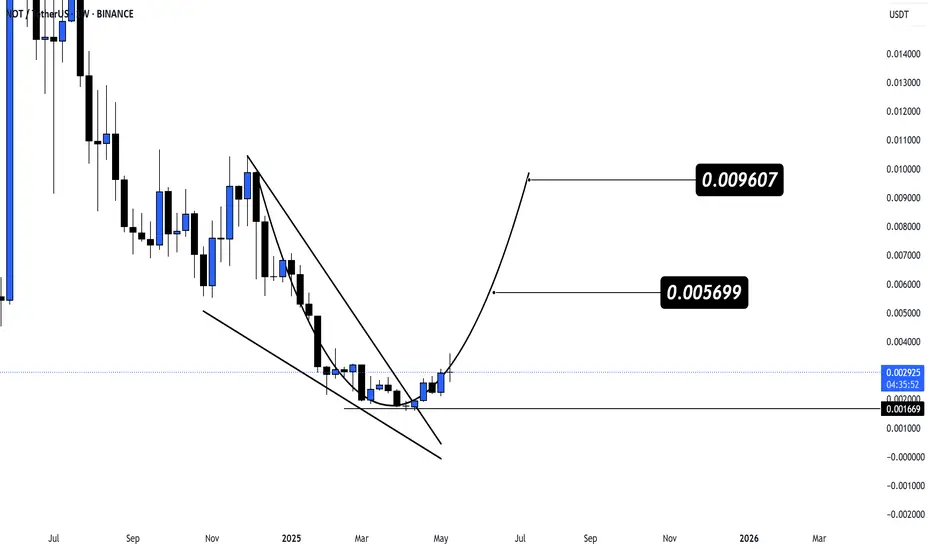
✅ Rounded Bottom Pattern Formation
ENA appears to be forming a rounded bottom, a classic accumulation and reversal pattern. Price has bounced from a strong demand zone near $0.25, where historically bulls have shown aggressive entry.
🔍 Technical Breakdown:
Accumulation Zone (Support): $0.2515 – acting as the long-term base.
Current Price: ~$0.3788
Pattern Type: Rounded Bottom with higher low structure.
Bias: Bullish continuation if weekly candle closes above current consolidation.
🎯 Target Projections:
Target 1: $0.8050 – Psychological & technical resistance
Target 2: $1.0849 – Mid-range supply
Target 3: $1.3595 – Measured move completion of the pattern
📈 Bullish Confirmation:
Breakout from the right shoulder above $0.40–$0.45 zone would confirm upward momentum.
Watch for volume confirmation and strong closes above weekly highs.
⚠️ Invalidation Level:
Drop below $0.2515 would invalidate the pattern and signal continuation of the downtrend.
📝 Summary:
ENA is showing a technically clean bottoming structure. If buyers step in with volume, the chart supports a potential +200% upside from current levels. Ideal zone for long positioning was highlighted at the base, with a healthy risk-to-reward structure.
Subscribe to my Telegram Channel 👉 :
t.me/addlist/y5mi70s3c0Y3MDQ0
Subscribe to my X 👉 : x.com/VIPROSETR
t.me/addlist/y5mi70s3c0Y3MDQ0
Subscribe to my X 👉 : x.com/VIPROSETR
Disclaimer
The information and publications are not meant to be, and do not constitute, financial, investment, trading, or other types of advice or recommendations supplied or endorsed by TradingView. Read more in the Terms of Use.
