The recent price action of 
 NOTUSDT has showcased a mix of volatility and potential as the asset navigates through various support and resistance levels. Analyzing the 4-hour chart reveals critical insights into its likely movements and trading opportunities.
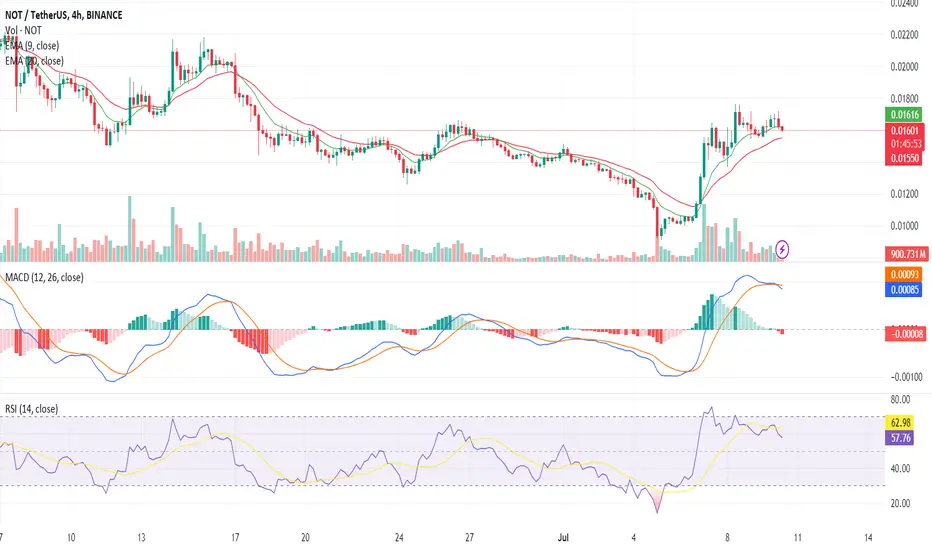
Starting with the closing prices, there have been fluctuations between $0.01621 and $0.0159, indicating a short-term downward trend. The 9 EMA is currently positioned above the 20 EMA, suggesting a possible short-term bullish momentum. However, the convergence of these EMAs around the latest price points calls for caution, as it may indicate an upcoming crossover that could shift momentum.
The Relative Strength Index (RSI), which oscillates between 56.76 and 64.90, hints at a cooling off period after reaching overbought territory. With the RSI hovering around 59.68 in the most recent data, the asset appears to be in a neutral zone, not giving a clear signal for either overbought or oversold conditions.
The Moving Average Convergence Divergence (MACD) paints a mixed picture. While the MACD line was above the signal line in earlier sessions, indicating bullish momentum, the recent crossover and the histogram turning negative suggest a bearish shift. This transition calls for traders to be vigilant as the market sentiment might be turning.
In terms of support and resistance, the Notcoin price is testing the resistance level at $0.01615. A successful breakout above this level could pave the way for a challenge at $0.016314. On the downside, the support at $0.01596 is crucial; a breach here might see the price testing lower support levels at $0.01566 and potentially $0.01536.
For traders considering long positions, waiting for a confirmation of a breakout above $0.01615 could be prudent. This could provide a potential entry point with an eye on the next resistance at $0.016314. Conversely, should the price fail to sustain above $0.01596, it might be wise to hold off on long entries until further stabilization around lower support levels.
For those eyeing short positions, the recent bearish MACD signal and the RSI cooling off suggest that there could be room for downward movement. Entry points could be considered around the resistance levels of $0.01615, with exit targets set around the support levels of $0.01566 or $0.01536, depending on the risk appetite.
Disclaimer
The information and publications are not meant to be, and do not constitute, financial, investment, trading, or other types of advice or recommendations supplied or endorsed by TradingView. Read more in the Terms of Use.
Disclaimer
The information and publications are not meant to be, and do not constitute, financial, investment, trading, or other types of advice or recommendations supplied or endorsed by TradingView. Read more in the Terms of Use.