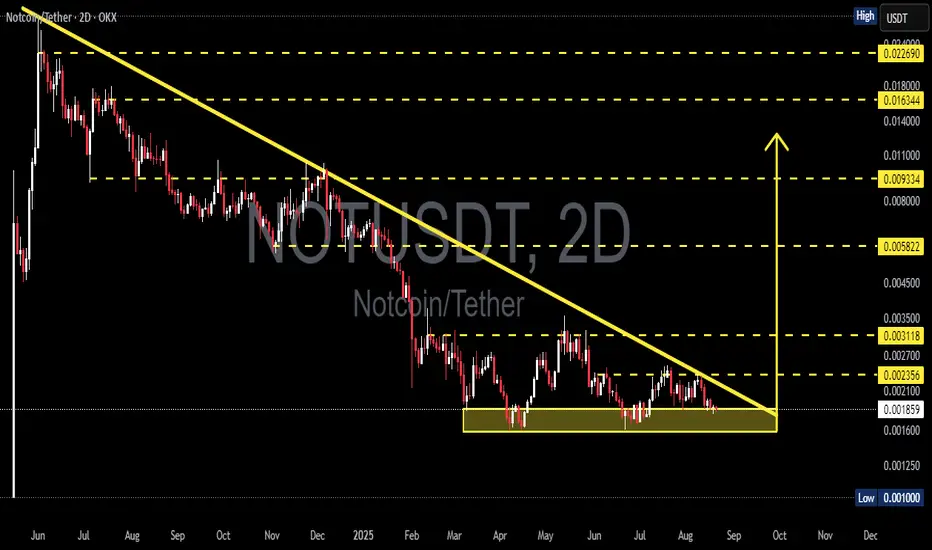
Currently, NOT/USDT is trading at a decisive point after a long downtrend. The chart clearly forms a Descending Triangle, a classic pattern that often signals bearish continuation, but under certain conditions can turn into a bullish reversal if a strong breakout occurs.
---
🔎 Pattern & Context
Main Pattern: Descending Triangle (consistent lower highs + strong horizontal support).
Support Zone: 0.0016 – 0.0019 (yellow box). This zone has been tested multiple times, showing buyers are still defending it.
Previous Trend: Strong bearish trend → favors breakdown, but reversal potential remains if bulls manage to break above the descending trendline.
Momentum: Price is being squeezed at the apex of the triangle → a major move is likely imminent.
---
🟢 Bullish Scenario (Upside Breakout)
If price successfully breaks above the descending trendline with a 2D close + strong volume, a reversal setup will be triggered.
🎯 Bullish Targets:
First target: 0.002356 (nearest resistance).
Next targets: 0.003118 → 0.005822.
If strong momentum continues → potential extension toward 0.0093 – 0.0163 (resistance levels shown on chart).
📌 Validation: Breakout + successful retest of the trendline (turning into new support) increases bullish probability.
---
🔴 Bearish Scenario (Downside Breakdown)
If price fails to hold the 0.0016 – 0.0019 support zone, the descending triangle plays out as a bearish continuation pattern.
🎯 Bearish Targets:
Initial target: 0.0010 (previous major low).
If selling pressure accelerates → potential formation of new lows below 0.0010.
📌 Validation: 2D candle close below 0.0016 with strong volume + failed retest = confirmed breakdown.
---
📌 Conclusion & Key Notes
0.0016 – 0.0019 is the key decision zone. Holding it opens the door for a bullish reversal, while breaking it signals continuation of the downtrend.
A major move is approaching as price gets compressed at the triangle’s apex.
Watch out for false breakouts / breakdowns → always wait for volume confirmation.
Strict risk management is crucial, especially for low-cap coins with high volatility and manipulation risks.
#NOT #NOTUSDT #Crypto #Altcoin #PriceAction #TechnicalAnalysis #DescendingTriangle #Breakout #Bearish #Bullish
---
🔎 Pattern & Context
Main Pattern: Descending Triangle (consistent lower highs + strong horizontal support).
Support Zone: 0.0016 – 0.0019 (yellow box). This zone has been tested multiple times, showing buyers are still defending it.
Previous Trend: Strong bearish trend → favors breakdown, but reversal potential remains if bulls manage to break above the descending trendline.
Momentum: Price is being squeezed at the apex of the triangle → a major move is likely imminent.
---
🟢 Bullish Scenario (Upside Breakout)
If price successfully breaks above the descending trendline with a 2D close + strong volume, a reversal setup will be triggered.
🎯 Bullish Targets:
First target: 0.002356 (nearest resistance).
Next targets: 0.003118 → 0.005822.
If strong momentum continues → potential extension toward 0.0093 – 0.0163 (resistance levels shown on chart).
📌 Validation: Breakout + successful retest of the trendline (turning into new support) increases bullish probability.
---
🔴 Bearish Scenario (Downside Breakdown)
If price fails to hold the 0.0016 – 0.0019 support zone, the descending triangle plays out as a bearish continuation pattern.
🎯 Bearish Targets:
Initial target: 0.0010 (previous major low).
If selling pressure accelerates → potential formation of new lows below 0.0010.
📌 Validation: 2D candle close below 0.0016 with strong volume + failed retest = confirmed breakdown.
---
📌 Conclusion & Key Notes
0.0016 – 0.0019 is the key decision zone. Holding it opens the door for a bullish reversal, while breaking it signals continuation of the downtrend.
A major move is approaching as price gets compressed at the triangle’s apex.
Watch out for false breakouts / breakdowns → always wait for volume confirmation.
Strict risk management is crucial, especially for low-cap coins with high volatility and manipulation risks.
#NOT #NOTUSDT #Crypto #Altcoin #PriceAction #TechnicalAnalysis #DescendingTriangle #Breakout #Bearish #Bullish
✅ Get Free Signals! Join Our Telegram Channel Here: t.me/TheCryptoNuclear
✅ Twitter: twitter.com/crypto_nuclear
✅ Join Bybit : partner.bybit.com/b/nuclearvip
✅ Benefits : Lifetime Trading Fee Discount -50%
✅ Twitter: twitter.com/crypto_nuclear
✅ Join Bybit : partner.bybit.com/b/nuclearvip
✅ Benefits : Lifetime Trading Fee Discount -50%
Disclaimer
The information and publications are not meant to be, and do not constitute, financial, investment, trading, or other types of advice or recommendations supplied or endorsed by TradingView. Read more in the Terms of Use.
