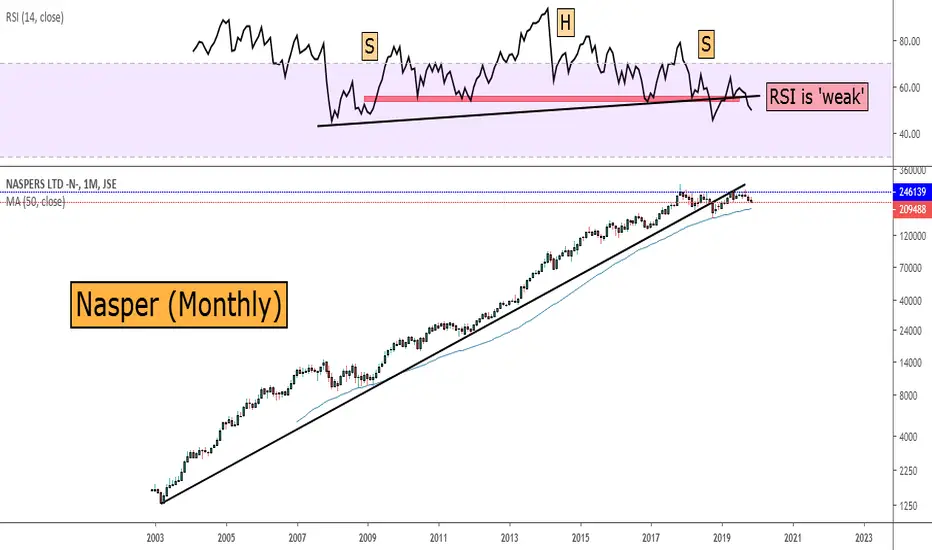
Equities | Naspers (Monthly): Once again taking a look at the monthly chart, it’s important to be reminded of the long term chart setup. The trend line support going back to the lows of 2003 has been breached with the price developing a double top formation.
Related publications
Disclaimer
The information and publications are not meant to be, and do not constitute, financial, investment, trading, or other types of advice or recommendations supplied or endorsed by TradingView. Read more in the Terms of Use.
Related publications
Disclaimer
The information and publications are not meant to be, and do not constitute, financial, investment, trading, or other types of advice or recommendations supplied or endorsed by TradingView. Read more in the Terms of Use.