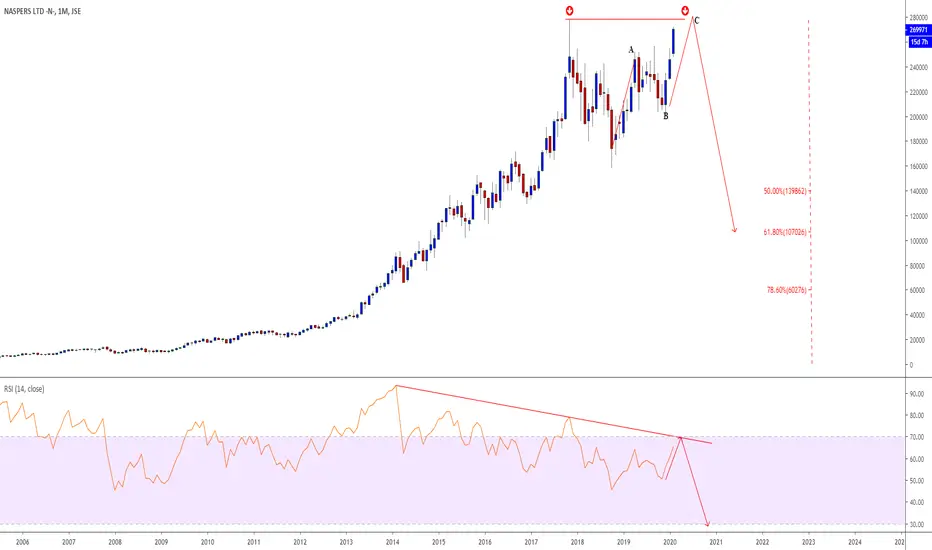
On the Monthly chart for Naspers, here is what I see, we had a bullish reversal pinbar which shows that buyers did take the market up to the 278447 level on 2017 but for the past two years it hasnt been able to get back to that level, meaning the sellers were also trying to gain momentum in that period. Now my prediction is that the buyers are going to be still a little dominant but its for a short period, maybe in the next two months but after that we looking at a more stronger short position. I believe that leg "A" should be equal to leg "C" thus the set target which is almost complete. The drop there should drop us down all the way to the 50.00 or 61.8 Fb zone. Lastly, we also have the RSI Divergence confirming, now we just need to lookout on smaller timeframes for better risk management.
Disclaimer
The information and publications are not meant to be, and do not constitute, financial, investment, trading, or other types of advice or recommendations supplied or endorsed by TradingView. Read more in the Terms of Use.
Disclaimer
The information and publications are not meant to be, and do not constitute, financial, investment, trading, or other types of advice or recommendations supplied or endorsed by TradingView. Read more in the Terms of Use.