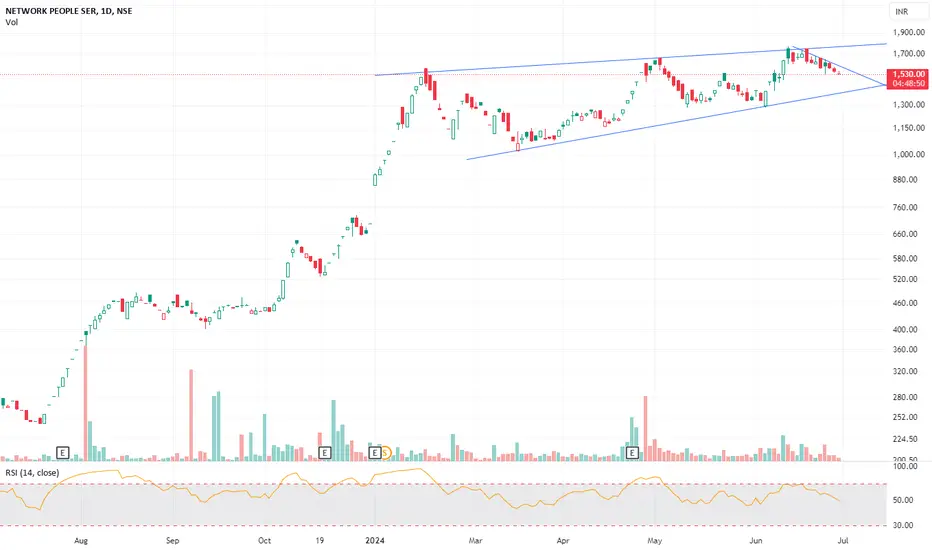
On the daily chart, NPST is forming an ascending triangle pattern, a bullish continuation signal. The price has been making higher lows, suggesting accumulating buying pressure.
If the price breaks above the trendline, it could signal a continuation of the uptrend. However, if it fails to break through, it might revisit the lower boundary of the triangle or even the 21-day EMA, potentially testing investor sentiment and patience.
If the price breaks above the trendline, it could signal a continuation of the uptrend. However, if it fails to break through, it might revisit the lower boundary of the triangle or even the 21-day EMA, potentially testing investor sentiment and patience.
Trade active
Broke the counter trend line and smoothly sustaining above resistance line. If sustain above 2000
T1 - 2400
T2 - 3000
Trade active
T1 reached waiting for T2
Trade closed: target reached
T2 reachedDisclaimer
The information and publications are not meant to be, and do not constitute, financial, investment, trading, or other types of advice or recommendations supplied or endorsed by TradingView. Read more in the Terms of Use.
Disclaimer
The information and publications are not meant to be, and do not constitute, financial, investment, trading, or other types of advice or recommendations supplied or endorsed by TradingView. Read more in the Terms of Use.