1D Timeframe: The daily chart shows a strong bullish trend with consecutive green candles indicating sustained buying pressure. This suggests institutional accumulation and a lack of significant sell-side resistance.
4H Timeframe: The 4-hour chart presents a continuation of the bullish momentum with recent candles forming higher highs. This indicates ongoing institutional demand and a potential preparation for a further push upwards.
1H Timeframe: On the hourly chart, we observe a slight pullback in the form of a small bearish candle. This could represent a minor profit-taking phase or a setup for a liquidity sweep to capture stops below recent lows before continuing the uptrend.
15M Timeframe: The 15-minute chart shows more pronounced pullbacks, yet these are contained within the overall bullish structure observed on higher timeframes. This could be indicative of retail selling or minor institutional rebalancing.
5M and 1M Timeframes: Both these lower timeframes display increased volatility and a sharper pullback. This is typical in lower timeframes where retail trading is more pronounced, and institutional traders may use these moves to engineer liquidity before making significant market moves.
INSTITUTIONAL THESIS:
Institutions appear to be in an accumulation phase, using minor pullbacks to engineer liquidity and trap retail traders on the wrong side of the market. The expectation is for continued upward movement once these phases complete.
LEARNING POINT:
"1H liquidity sweep before continuation of 4H bullish momentum."
SIGNAL: BUY
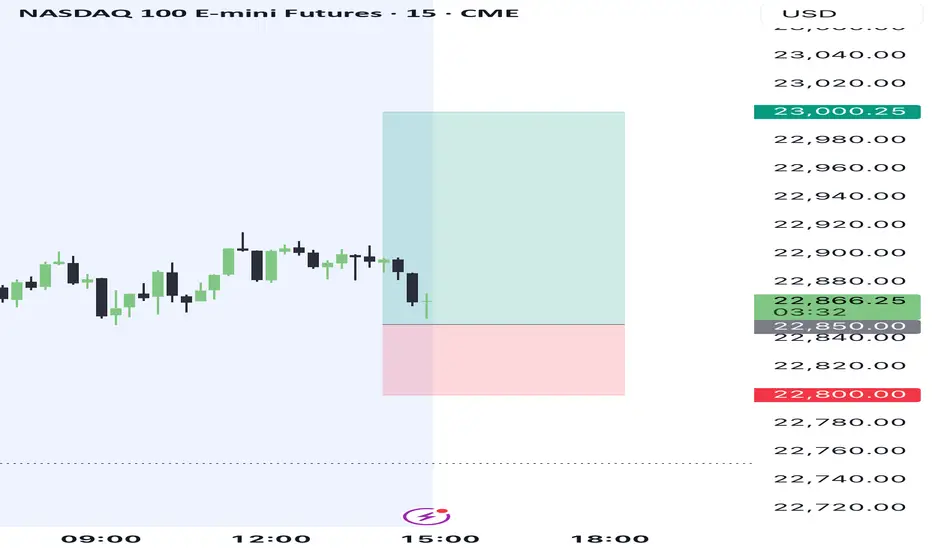
SYMBOL: NASDAQ 100 E-mini Futures (NQ1!) ENTRY PRICE: $22,850.00 STOP LOSS: $22,800.00 (below the recent minor low to account for any further liquidity sweeps) TARGET PRICE: $23,000.00 (next psychological round number and potential resistance area) CONDITION: Buy limit order post-1H liquidity sweep confirming a bullish continuation on the 15M timeframe. RATIONALE: The setup aligns with a bullish market structure on higher timeframes, a potential liquidity sweep on the 1H chart, and a continuation of buying pressure indicated by the 4H and 1D charts. STRATEGIES USED: 1H Liquidity Sweep, 4H Bullish Continuation URGENCY: MEDIUM TIMEFRAME: Short-term to medium-term CONFIDENCE SCORE: 85% (based on alignment across multiple timeframes and clear bullish signals) RISK/REWARD RATIO: Calculated as follows:
Risk: $22,850.00 (entry) - $22,800.00 (stop) = $50.00
Reward: $23,000.00 (target) - $22,850.00 (entry) = $150.00
Ratio: $150.00 / $50.00 = 3:1
This trade setup offers a favorable risk/reward ratio exceeding the minimum 2:1 threshold, aligning with institutional trading principles and confirming a high-probability entry for a bullish continuation.
4H Timeframe: The 4-hour chart presents a continuation of the bullish momentum with recent candles forming higher highs. This indicates ongoing institutional demand and a potential preparation for a further push upwards.
1H Timeframe: On the hourly chart, we observe a slight pullback in the form of a small bearish candle. This could represent a minor profit-taking phase or a setup for a liquidity sweep to capture stops below recent lows before continuing the uptrend.
15M Timeframe: The 15-minute chart shows more pronounced pullbacks, yet these are contained within the overall bullish structure observed on higher timeframes. This could be indicative of retail selling or minor institutional rebalancing.
5M and 1M Timeframes: Both these lower timeframes display increased volatility and a sharper pullback. This is typical in lower timeframes where retail trading is more pronounced, and institutional traders may use these moves to engineer liquidity before making significant market moves.
INSTITUTIONAL THESIS:
Institutions appear to be in an accumulation phase, using minor pullbacks to engineer liquidity and trap retail traders on the wrong side of the market. The expectation is for continued upward movement once these phases complete.
LEARNING POINT:
"1H liquidity sweep before continuation of 4H bullish momentum."
SIGNAL: BUY
SYMBOL: NASDAQ 100 E-mini Futures (NQ1!) ENTRY PRICE: $22,850.00 STOP LOSS: $22,800.00 (below the recent minor low to account for any further liquidity sweeps) TARGET PRICE: $23,000.00 (next psychological round number and potential resistance area) CONDITION: Buy limit order post-1H liquidity sweep confirming a bullish continuation on the 15M timeframe. RATIONALE: The setup aligns with a bullish market structure on higher timeframes, a potential liquidity sweep on the 1H chart, and a continuation of buying pressure indicated by the 4H and 1D charts. STRATEGIES USED: 1H Liquidity Sweep, 4H Bullish Continuation URGENCY: MEDIUM TIMEFRAME: Short-term to medium-term CONFIDENCE SCORE: 85% (based on alignment across multiple timeframes and clear bullish signals) RISK/REWARD RATIO: Calculated as follows:
Risk: $22,850.00 (entry) - $22,800.00 (stop) = $50.00
Reward: $23,000.00 (target) - $22,850.00 (entry) = $150.00
Ratio: $150.00 / $50.00 = 3:1
This trade setup offers a favorable risk/reward ratio exceeding the minimum 2:1 threshold, aligning with institutional trading principles and confirming a high-probability entry for a bullish continuation.
Disclaimer
The information and publications are not meant to be, and do not constitute, financial, investment, trading, or other types of advice or recommendations supplied or endorsed by TradingView. Read more in the Terms of Use.
Disclaimer
The information and publications are not meant to be, and do not constitute, financial, investment, trading, or other types of advice or recommendations supplied or endorsed by TradingView. Read more in the Terms of Use.