Key Observations
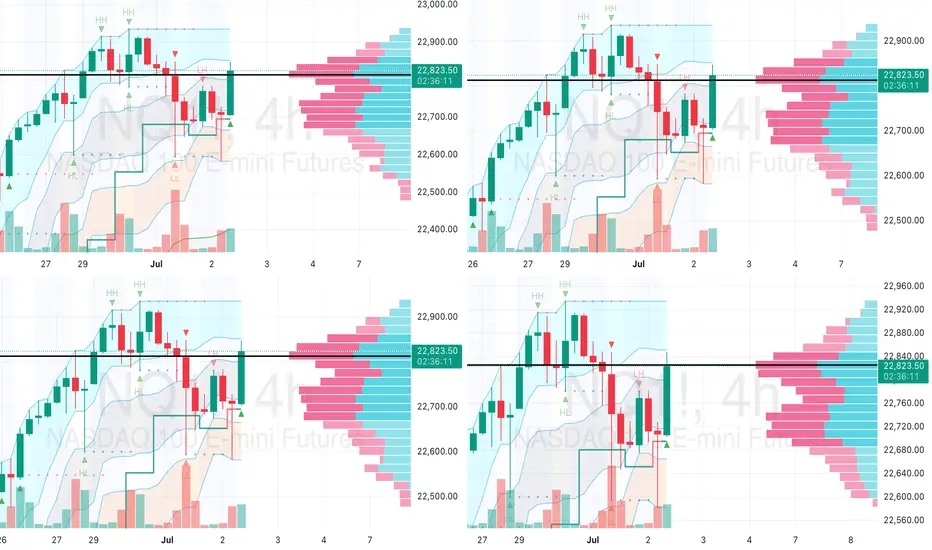
The NQ is currently trading at 22,706.50, with a high of 22,847.50 and a low of 22,702.75, based on the 4-hour chart provided, timestamped at 11:22:26 UTC (7:22:26 AM EDT).
The price has pulled back from a recent high of 22,829.00 (recorded at 02:37:34) and is testing support near 22,700–22,720.
The market shows a short-term consolidation after a strong upward move, with potential for further direction depending on upcoming economic data.
Technical Analysis
Price Action: The chart displays a series of higher highs and higher lows since late June, indicating an overall uptrend. However, the recent red candles and rejection at 22,829.00 suggest a possible short-term reversal or pause. The current level of 22,706.50 is near a support zone marked by previous consolidation.
Volume Profile: The right-hand volume profile highlights high volume nodes (HVNs) between 22,700 and 22,829, with the point of control (POC) around 22,829.00. The pink bars (selling volume) dominate above 22,829, indicating strong resistance, while teal bars (buying volume) are concentrated around 22,700–22,720, suggesting a support area.
Support and Resistance:
Support: 22,700–22,720 (current level and volume-based support), with deeper support at 22,600–22,650 if the price breaks lower.
Resistance: 22,829.00 (recent high and POC), with a psychological barrier at 23,000 if bullish momentum resumes.
Indicators: The Market Profile (e.g., HH, HL, LH, LL) shows a value area narrowing near 22,700–22,829, indicating indecision. The presence of multiple timeframes (4-hour) suggests this is a key level for swing traders.
Market Context
The pullback aligns with recent economic data, including the June 2025 ADP employment report (released July 02), which reported a loss of 33,000 jobs, below the expected 100,000. This could signal economic slowdown, impacting tech-heavy indices like the NASDAQ 100.
Negative sentiment around Tesla, a significant NQ component, due to an Elon Musk-Donald Trump incident, may be contributing to the pressure.
The Nonfarm Payrolls report on July 03, 2025, is a critical upcoming event. A weaker result (forecasted at 110,000 jobs) could exacerbate selling, while a strong report might support a recovery.
Scenarios
Bullish Case: If the price holds above 22,700 and breaks 22,829 with increased buying volume, it could target 23,000. Look for a strong bullish candle to confirm.
Bearish Case: A break below 22,700 could see the price drop to 22,600–22,650, with further downside possible if selling intensifies.
Volatility: Expect increased volatility ahead of the Nonfarm Payrolls data, given its potential to sway market direction.
Join my trading community on Discord! 📈 Use all our indicators for FREE
discord.gg/xPEDcNEupw
discord.gg/xPEDcNEupw
Disclaimer
The information and publications are not meant to be, and do not constitute, financial, investment, trading, or other types of advice or recommendations supplied or endorsed by TradingView. Read more in the Terms of Use.