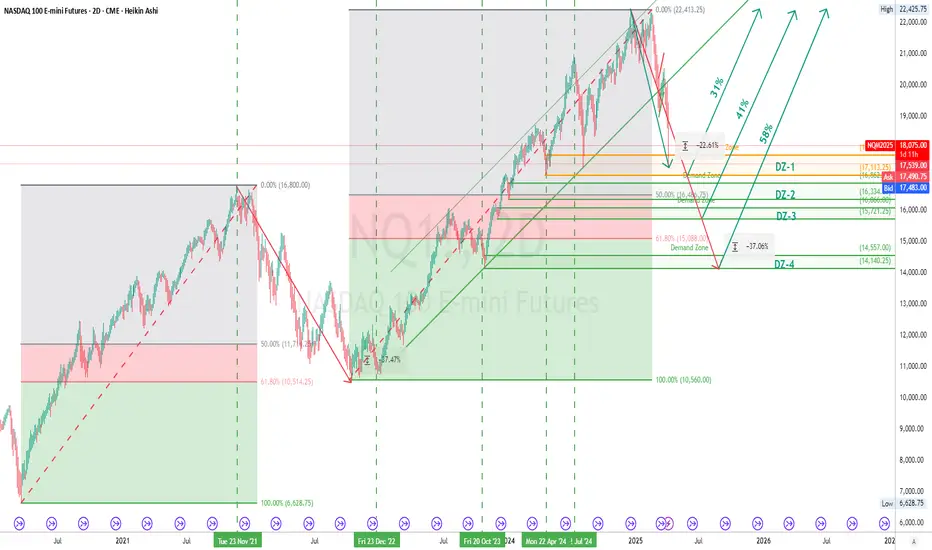
📈 The NASDAQ 100 is currently trading at 18,075.00, which represents a -22.6% decline from the all-time high of 22,425.75. This marks a significant drop from its peak, entering into what could be classified as a bear market by traditional standards.
📊The previous decline from the high of 16,800.00 in November 2021 saw a decline of 37.47%, eventually bottoming out at the 61.8% Fibonacci retracement level (10,514.25), from which it staged a significant recovery to reach the all-time high of 22,425.75.
📊Current Demand Zones & Fibonacci Levels:
These zones represent potential reversal areas where buyers could regain control. The Fibonacci retracement levels align well with historical price action, reinforcing their significance as support zones.
DZ-1 (17,539.00-16,334.85):Approximately the 50% Fibonacci retracement of the recent bull rally
DZ-2 (16,334.85-15,384.25):Approximately the 61.8% Fibonacci retracement - Historically a strong support level
DZ-3 (15,384.25-14,557.00):Critical structural level with prior buyer interest
DZ-4 (14,557.00-14,140.25):Deep support level - key psychological zone
📈 Recovery Potential
To regain the all-time high of 22,425.75, the market would need to achieve the following percentage gains from each demand zone:
From DZ-1 (Top: 17,539.00, Base: 16,334.85): 📈 +37.3% to all-time high
From DZ-2 (Top: 16,334.85, Base: 15,384.25): 📈 +45.8% to all-time high
From DZ-3 (Top: 15,384.25, Base: 14,557.00): 📈 +54.0% to all-time high
From DZ-4 (Top: 14,557.00, Base: 14,140.25): 📈 +58.6% to all-time high
The DZ-2 to DZ-3 range provides the most likely region for a significant reversal based on confluence between historical support levels and Fibonacci retracements. While DZ-4 aligns with the 37% historical decline.
🔑 Key Takeaways
The NASDAQ 100 s is in a significant correction phase, down -22.6% from its peak.
Price is approaching critical Demand/support zones (DZ-1 to DZ-4), which may act as reversal points.
A return to all-time highs would require substantial gains, particularly if the market reaches the deeper demand zones.
Investors should closely monitor price action around the DZ-2 to DZ-3 range (15,384.25 - 14,557.00) for signs of a potential reversal.
Additionally, staying updated on developments related to the new tariffs is essential, as they may heavily influence market dynamics in the coming months.
Disclaimer
The information and publications are not meant to be, and do not constitute, financial, investment, trading, or other types of advice or recommendations supplied or endorsed by TradingView. Read more in the Terms of Use.
Disclaimer
The information and publications are not meant to be, and do not constitute, financial, investment, trading, or other types of advice or recommendations supplied or endorsed by TradingView. Read more in the Terms of Use.