1. Market Context
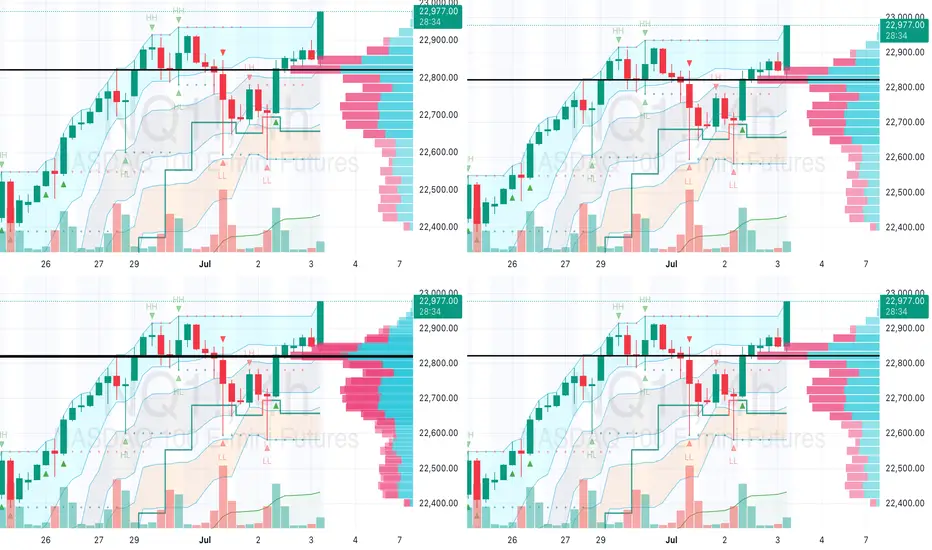
Timeframe: Daily chart from June 26 to July 4, 2025, with data current as of 09:29 AM EDT, July 3, 2025.
Trend: The price has been in an uptrend, breaking above 22,600.00 and approaching resistance near 22,915.00-23,000.00, consistent with recent bullish momentum in NQ futures (TradingView, CME Group).
2. Key Levels
Support: Immediate support at 22,600.00-22,700.00, where moving averages and prior consolidation align. A deeper support lies around 22,400.00 (lower trendline).
Resistance: Key resistance at 22,915.00, with a potential target at 23,000.00. A break above could aim for 23,200.00-23,400.00 (Fibonacci levels from web sources).
Stop Loss: Place below support (e.g., 22,580.00) to protect against a reversal.
Take Profit: Target 23,000.00 initially, with an extended goal at 23,400.00 if momentum holds.
3. Technical Indicators
Candlestick Patterns: Green candles near 22,915.00 suggest buying pressure, but red candles and dojis indicate potential indecision or rejection at resistance.
Volume: At 31.54K, volume is moderate. A spike on a breakout would confirm strength; a decline might signal exhaustion.
Moving Averages: The chart shows multiple MAs (e.g., 50-day, 200-day). Price above these supports the uptrend; a cross below could signal a shift.
4. Trade Plan
Entry: Enter long near 22,900.00 if consolidation holds, or on a breakout above 22,915.00 with volume confirmation.
Risk-Reward Ratio: Aim for 1:2 (e.g., risk 20 points to gain 40 points toward 23,000.00, or 400 points toward 23,400.00).
Position Sizing: Base on your account size and 1-2% risk per trade, considering NQ’s $20 multiplier per point.
Exit Strategy: Take partial profits at 23,000.00 and trail the rest, or exit fully if resistance holds.
5. Risk Management
Volatility: NQ’s recent range (22,400.00-22,915.00) suggests moderate volatility. Use tight stops due to potential news-driven moves.
News/Event Risk: Monitor Fed statements or tech earnings (key NQ drivers per CME Group) scheduled around July 3-4, 2025.
6. Scenario Analysis
Bullish Case: A break above 22,915.00 with strong volume could push NQ to 23,200.00-23,400.00, aligning with Fibonacci targets (TradingView).
Bearish Case: Rejection at 22,915.00 with a red candle might drop to 22,600.00-22,700.00. Cut losses if support fails.
Join my trading community on Discord! 📈 Use all our indicators for FREE
discord.gg/xPEDcNEupw
discord.gg/xPEDcNEupw
Disclaimer
The information and publications are not meant to be, and do not constitute, financial, investment, trading, or other types of advice or recommendations supplied or endorsed by TradingView. Read more in the Terms of Use.