tradingview.com/chart/vYaceW5a/?symbol=CME_MINI:NQ1!
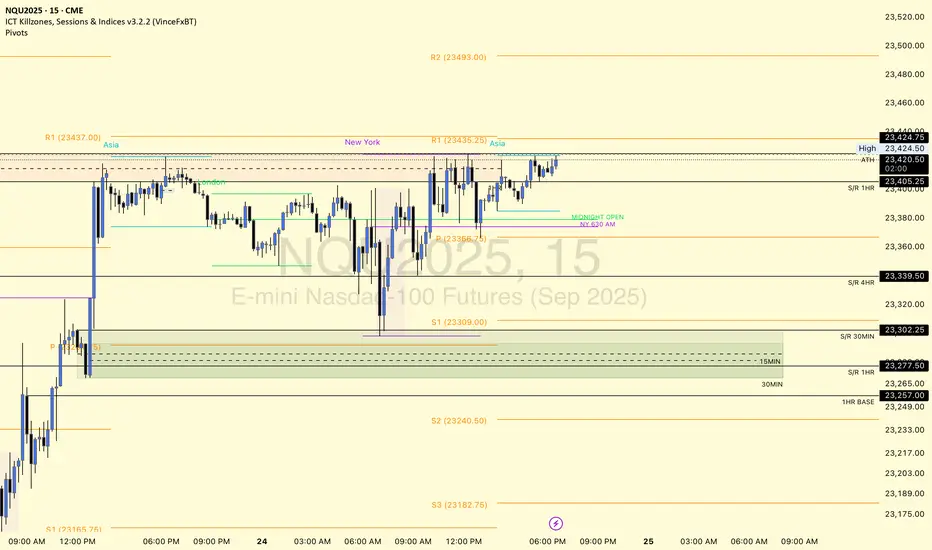
This is NNQ chart for my YouTube community.
Intrigued to see if we sweep for a new ATH or a rejection to test demand levels below.
With a new ATH, gotta wait for more S/D S/R levels to be created.
Will resort to imbalance playbook or S/R play until then.
This is NNQ chart for my YouTube community.
Intrigued to see if we sweep for a new ATH or a rejection to test demand levels below.
With a new ATH, gotta wait for more S/D S/R levels to be created.
Will resort to imbalance playbook or S/R play until then.
Disclaimer
The information and publications are not meant to be, and do not constitute, financial, investment, trading, or other types of advice or recommendations supplied or endorsed by TradingView. Read more in the Terms of Use.
Disclaimer
The information and publications are not meant to be, and do not constitute, financial, investment, trading, or other types of advice or recommendations supplied or endorsed by TradingView. Read more in the Terms of Use.