tradingview.com/chart/vYaceW5a/?symbol=CME_MINI:NQ1!
This NNQ chart is posted for my YouTube community.
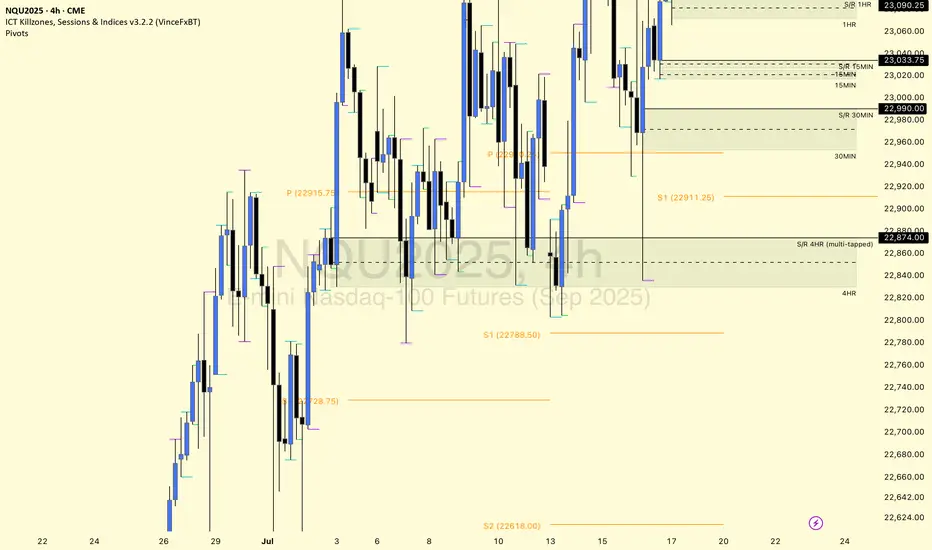
The 1HR S/R level is holding price down well for now and we have tapped into the 4HR supply 2x so far. We have built up support that can use as potential bounce levels if* respected, but price needs to reclaim the S/R level and show higher lows. If not, a continuous close at lower lows with rejecting support at demand can show price dropping to 22830-23000 zones. The 4HR demand below has also been tapped into multiple times, so it's only a matter of time before it can no longer hold up (it's pretty much invalidated at this point lol).
This NNQ chart is posted for my YouTube community.
The 1HR S/R level is holding price down well for now and we have tapped into the 4HR supply 2x so far. We have built up support that can use as potential bounce levels if* respected, but price needs to reclaim the S/R level and show higher lows. If not, a continuous close at lower lows with rejecting support at demand can show price dropping to 22830-23000 zones. The 4HR demand below has also been tapped into multiple times, so it's only a matter of time before it can no longer hold up (it's pretty much invalidated at this point lol).
Disclaimer
The information and publications are not meant to be, and do not constitute, financial, investment, trading, or other types of advice or recommendations supplied or endorsed by TradingView. Read more in the Terms of Use.
Disclaimer
The information and publications are not meant to be, and do not constitute, financial, investment, trading, or other types of advice or recommendations supplied or endorsed by TradingView. Read more in the Terms of Use.